Physical Address
304 North Cardinal St.
Dorchester Center, MA 02124
Physical Address
304 North Cardinal St.
Dorchester Center, MA 02124

Learn how to read dark pool data, identify institutional print clusters, and use sector and ticker context to improve your trading workflow.
Dark pool data gives retail traders a way to study where institutions were active outside the public order book. The edge is not in pretending every single print predicts the future. The edge is in learning how to read repeated activity, compare it to normal behavior, and use it to build better context around levels, sectors, and trade selection.
Dark pool data is most useful when it helps answer practical questions: where were institutions active, is the activity unusual versus normal history, and does that activity line up with broader sector or chart context? That is the frame this guide uses.
Retail traders get into trouble when they treat a dark pool print like a magical buy or sell signal. A better use is understanding where executed size actually happened, then combining that with normal charting, sector context, and disciplined trade selection.
Dark pools are private trading venues where large participants can execute stock transactions away from the public order book. After those trades are reported, the resulting data gives traders a delayed but still valuable view into where large money was active. That matters because public charts often show only the visible surface of market activity.
Retail traders often overreact to one giant print. In practice, a single print is often less useful than repeated transactions at similar prices over multiple sessions. That repetition can reveal institutional cost-basis zones, recurring accumulation behavior, or price areas where bigger participants were consistently willing to transact.
Dark pool data is not a replacement for charts, market structure, catalyst awareness, or risk management. It works best as an added layer: where institutions were active, how unusual the activity is versus normal history, and whether the same theme appears across the broader sector or ETF complex.
The public chart is only part of the story. Dark pool data helps reveal where larger participants were active away from the public order book. That can matter because institutions often build or unwind positions in ways that do not show up clearly on a standard chart until later.
Used well, dark pool data helps traders prioritize names, identify better support and resistance context, and notice sector rotation earlier. Used badly, it just becomes another source of overconfidence. The difference is process.
Every useful dark pool workflow starts with a few fields: ticker, price, shares, dollar value, and timestamp. The ticker tells you what traded. The price tells you where the trade occurred. Shares and dollar value tell you whether the print is potentially meaningful. The timestamp helps you understand whether the activity was clustered or isolated.
Example: A 400,000-share print at a key level in a mid-cap stock is a different kind of signal than a similar-sized print in a highly liquid index ETF.
This matters because traders who use how to read dark pool data well are usually building context, not chasing noise. The goal is to let institutional activity improve your process before a move becomes obvious on a simple chart.
A print is only meaningful in context. A large ETF print may be routine. A smaller print in a lower-volume stock may be highly unusual. Compare the transaction to normal daily volume, recent dark pool activity, and the stock’s typical liquidity profile before deciding it matters.
Example: If a stock normally shows light institutional activity and suddenly prints a series of large transactions over two sessions, that matters more than a routine large block in SPY.
This matters because traders who use how to read dark pool data well are usually building context, not chasing noise. The goal is to let institutional activity improve your process before a move becomes obvious on a simple chart.
This is where dark pool data becomes genuinely useful. Repeated prints at similar price ranges can show where institutions were willing to transact repeatedly. Those zones often become stronger practical reference points than chart-only support and resistance because they represent real executed size, not just visual pattern recognition.
Example: If a name keeps printing in the same narrow price band over several sessions, that cluster is usually more actionable than a one-off headline print.
This matters because traders who use how to read dark pool data well are usually building context, not chasing noise. The goal is to let institutional activity improve your process before a move becomes obvious on a simple chart.
Single-stock activity is easier to interpret when you understand whether the broader sector is also active. If the same theme appears in the sector ETF or across several peer names, the dark pool activity may reflect wider institutional rotation rather than an isolated company-specific idea.
Example: Elevated dark pool activity in a semiconductor stock means more when Technology sector flow is also elevated.
This matters because traders who use how to read dark pool data well are usually building context, not chasing noise. The goal is to let institutional activity improve your process before a move becomes obvious on a simple chart.
Dark pool data should make your charting smarter, not more chaotic. Mark the main cluster zones, compare them with prior highs/lows, consolidation areas, and trend structure, then use price behavior to decide whether the market is respecting those institutional levels.
Example: A pullback into a heavy print cluster that also lines up with a prior breakout zone is a much better context point than either signal alone.
This matters because traders who use how to read dark pool data well are usually building context, not chasing noise. The goal is to let institutional activity improve your process before a move becomes obvious on a simple chart.
The best traders use dark pool data as a filter. It helps decide what deserves deeper attention, what sectors are worth reviewing, and which names have unusual institutional participation. It should improve your watchlist and your context before it ever pushes you into a trade.
Example: If ten names are on your watchlist, the ones showing repeated unusual institutional activity should move to the top of the pile.
This matters because traders who use how to read dark pool data well are usually building context, not chasing noise. The goal is to let institutional activity improve your process before a move becomes obvious on a simple chart.
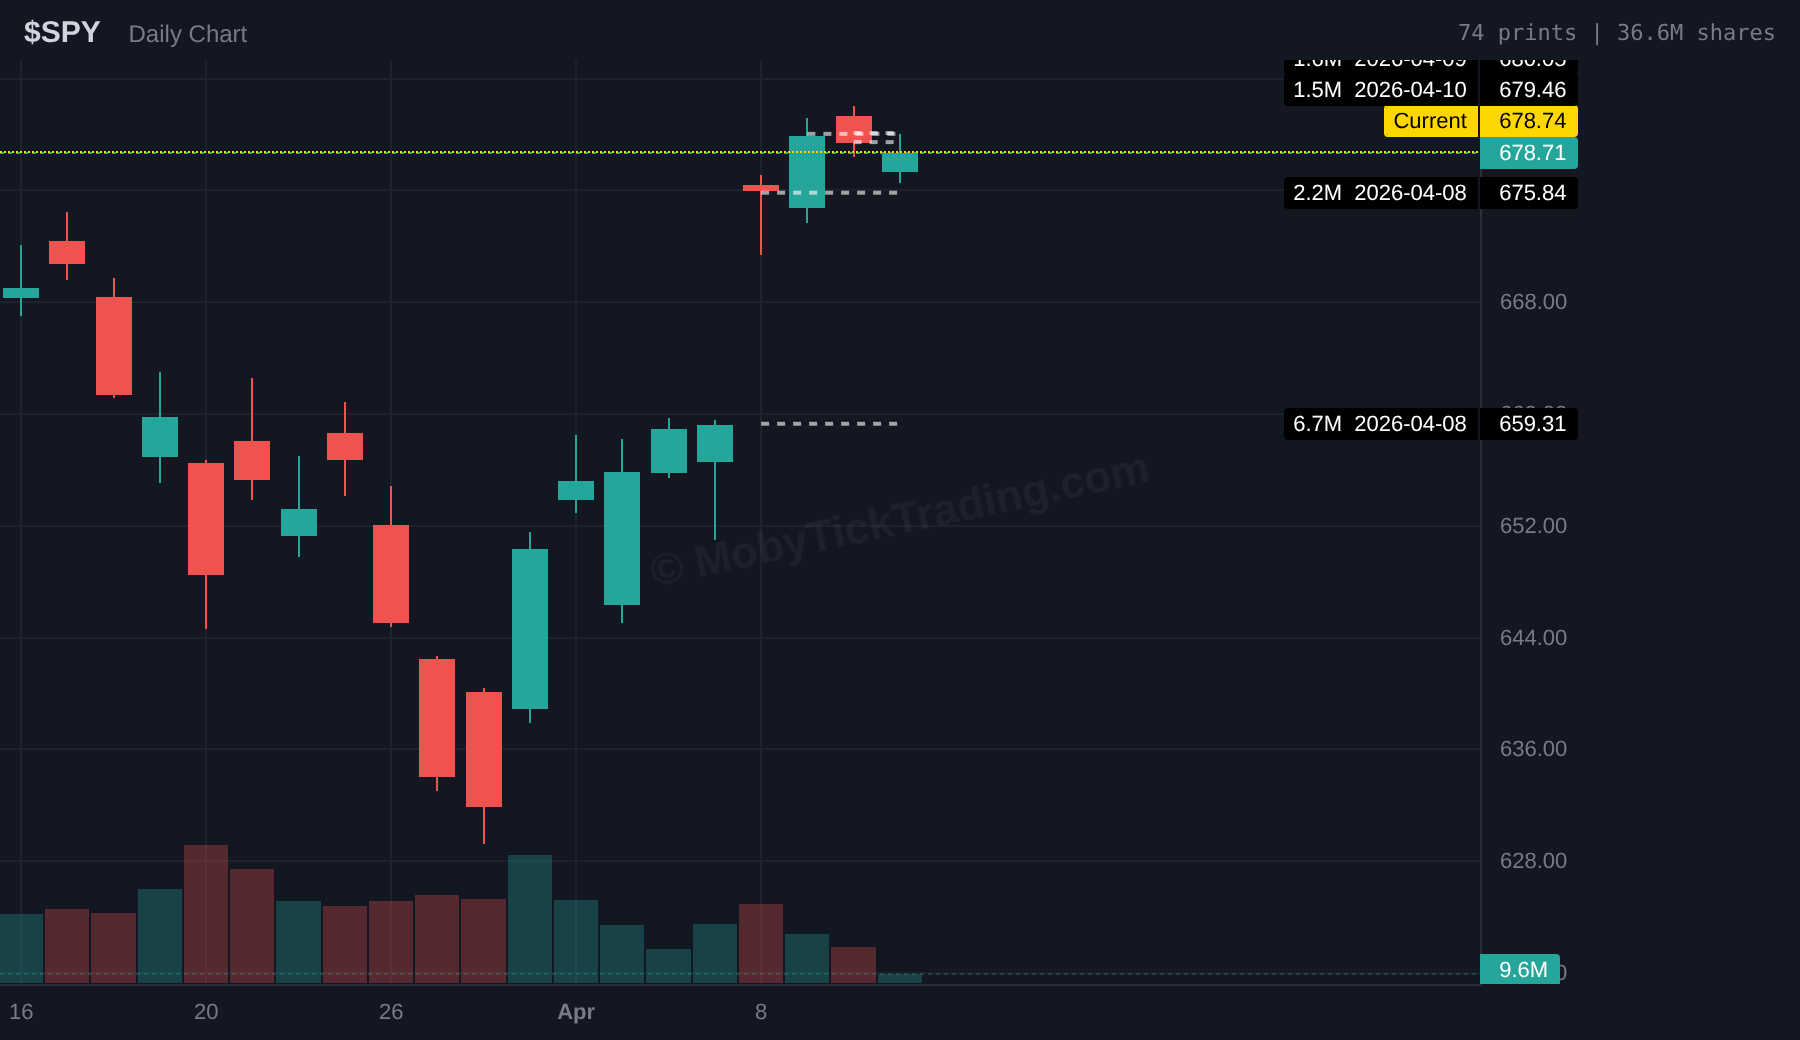
This SPY chart is useful because it shows how dark pool print levels can be marked directly on the chart instead of treated as abstract data. It gives traders a cleaner way to compare institutional activity with visible price structure.
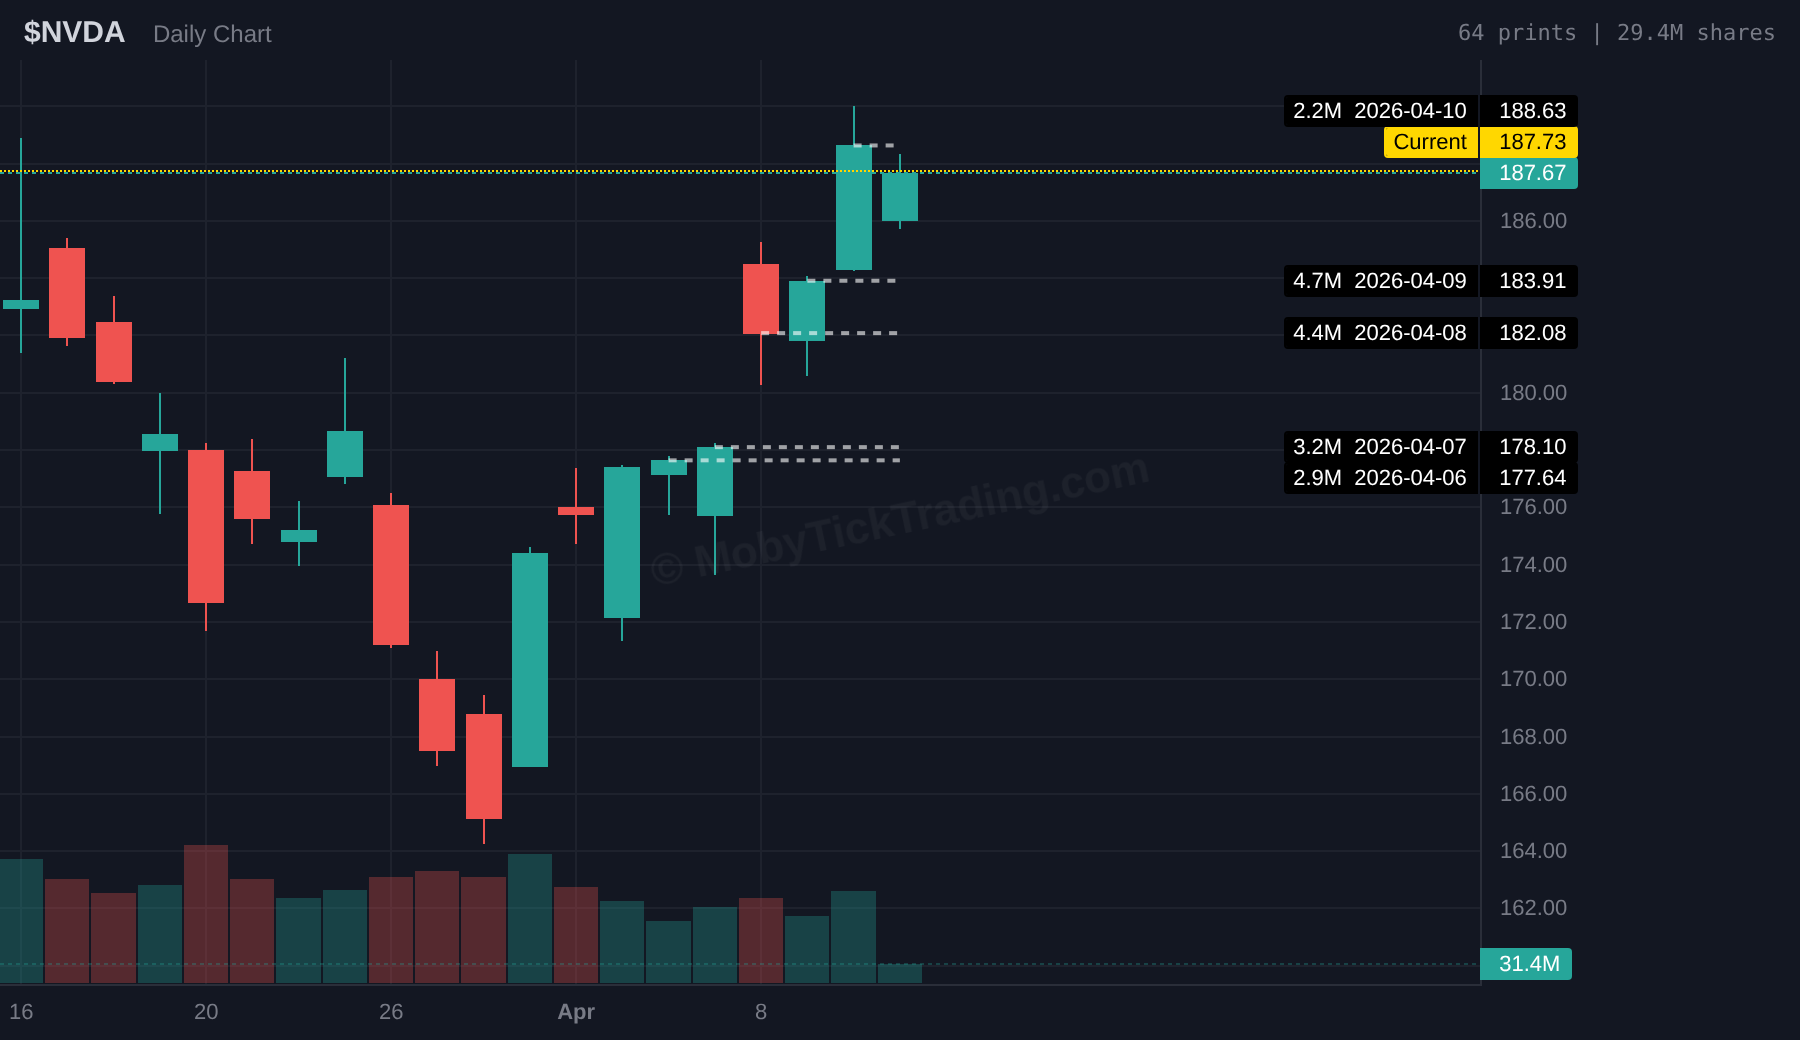
NVDA works well as an educational example because the print overlays make it easier to explain clustering, repeated levels, and why dark pool context is usually more useful when it builds over time.
A stock with multiple days of prints near one price range can reveal where institutions repeatedly transacted. That does not guarantee an immediate move, but it creates a more meaningful reference zone than a random horizontal line drawn after the fact.
What makes this practical is that the same logic can be checked across ticker pages, sector pages, and broader heatmap activity instead of forcing every name into the same simplistic interpretation.
ETF prints can reveal broad capital movement and sector rotation, but they are often less company-specific than individual stock prints. Use ETFs for macro context and single stocks for more precise level analysis.
What makes this practical is that the same logic can be checked across ticker pages, sector pages, and broader heatmap activity instead of forcing every name into the same simplistic interpretation.
If several names inside the same sector begin showing unusual dark pool activity at once, that often suggests broader institutional rotation rather than isolated single-name noise.
What makes this practical is that the same logic can be checked across ticker pages, sector pages, and broader heatmap activity instead of forcing every name into the same simplistic interpretation.
Most mistakes come from trying to force certainty out of data that is really best used as context. That is why the strongest workflows combine institutional activity with ordinary trade planning instead of replacing it.
These are simple habits, but they are what keep dark pool data useful. Without process, traders tend to turn institutional context into random confirmation bias.
Start on DarkPoolHeatmap.com to see which sectors are elevated. Then move into ticker pages to inspect recent print activity and relative context. If a name keeps showing up with unusual activity, mark the main levels and compare them to your chart.
That process works better than randomly browsing prints because it gives you a top-down filter: sector first, ticker second, levels third, execution last.
Can dark pool data tell me exactly whether institutions are buying or selling?
Not reliably from a single print. The more practical takeaway is where institutions were active and whether that activity repeated in ways that create useful price context.
Is dark pool data better for day trading or swing trading?
It is usually more valuable for swing trading, level analysis, and position-building context than for ultra-short-term reactions. Institutions often operate on a slower time horizon than retail intraday traders.
What is the best way to start using dark pool data for free?
Use DarkPoolHeatmap.com to see live sector and ticker-level institutional activity, then move to a deeper workflow like MobyTick if you want alerts, more history, and a stronger research process.
What is the biggest mistake people make with dark pool data?
Treating every large print like a guaranteed directional signal. The better use is context, clustering, relative activity, and institutional level analysis.
How to Read Dark Pool Data: A Practical Guide for Retail Traders becomes useful when it helps you understand where institutions were active and how unusual that activity really is. The data is not the trade. It is the context that helps you make better decisions before the trade.
If you build that habit, dark pool data becomes a filter for better watchlists, cleaner level identification, and stronger trade context. If you skip the process, it turns into noise very quickly.
See live institutional activity for free on DarkPoolHeatmap.com, or start your MobyTick trial if you want deeper history, alerts, and a stronger institutional workflow.
Want more dark pool education and weekly institutional context? Subscribe to the free weekly report.