Physical Address
304 North Cardinal St.
Dorchester Center, MA 02124
Physical Address
304 North Cardinal St.
Dorchester Center, MA 02124

A lot of traders hear dark pool data and assume it means some secret institutional feed that tells you exactly what smart money is doing.
Not quite.
Dark pool data is useful — very useful, actually — but only when you understand what it is, what it is not, and how to fit it into a real workflow instead of turning it into folklore.
This guide breaks down what dark pool data actually shows, why traders care about it, where most people misuse it, and how to use it in a way that improves research instead of creating fake certainty.
Dark pool data is the reported record of completed trades that happened away from the visible public order book.
These trades usually occur on off-exchange venues used by larger participants that want to reduce market impact when trading size. Once those trades are reported, the market can analyze the key details afterward.
At its most basic, dark pool data gives traders a way to study:
That makes it useful as a window into institutional participation, especially when the activity is unusual or keeps showing up in the same zone.
Dark pool data matters because it fills in a part of market structure that ordinary charting does not show very well. Public price and visible volume tell you what the tape is doing. Dark pool data helps show where size was actually reported away from the lit order book.
That difference is not cosmetic. It changes how a trader can think about:
That does not make dark pool data magical. It just makes it a useful layer that most retail workflows underuse.
Most retail platforms are great at showing visible chart action and public volume. They are much weaker at showing where meaningful off-exchange activity has been happening behind the scenes.
That gap matters because traders are trying to answer questions like:
Dark pool data helps with those questions.
It does not replace charting, catalysts, or execution discipline. But it can absolutely improve which names deserve more attention.
The first useful thing dark pool data gives you is simple: location.
It tells you where sizable transactions were reported in a given stock. If a name keeps showing large activity around a certain level, that price zone becomes more interesting than it would be from chart structure alone.
A print only matters in context.
A large-cap ETF can print huge size all the time without it meaning much. A similar notional value in a thinner stock may stand out immediately. That is why dark pool data works best when the platform helps compare current activity with recent baseline behavior.
The strongest institutional signal is often not a single huge print. It is repetition.
When large activity keeps appearing in the same area across multiple sessions, traders often treat that as a more meaningful institutional zone than an isolated one-off block.
Single-stock dark pool activity becomes more interesting when the broader sector also shows elevated off-exchange participation.
If multiple names in tech, energy, or financials are all seeing unusual dark pool activity around the same time, that can point to broader sector rotation or institutional focus rather than random ticker noise.
This is where a lot of traders get sloppy.
Dark pool data does not tell you:
That means dark pool data should be treated as a context tool, not a magic forecasting device.
If you use it to improve research, it helps. If you use it to invent certainty, it gets dumb fast.
The embedded chart below is one of the clearest ways to make the phrase “dark pool data” real. On our 2026-04-10 internal snapshot, the biggest reported value did not just show up in a single hot stock. It showed up heavily in SPY, QQQ, and IWM alongside single-name names like NVDA and MSFT.
That matters because dark pool data is often about portfolio positioning as much as stock-specific conviction. A trader who only looks for single-name narratives will miss a large part of what the data is actually saying.
Put differently: dark pool data helps you separate at least three different types of activity:
That separation is what makes the data useful instead of mystical.
Use a scan or heatmap to see which sectors and names are elevated. The goal here is not to make trade decisions yet. It is to reduce the universe.
Once you have a shortlist, inspect which names show repeated activity, unusual relative flow, and meaningful notional size.
Dark pool data becomes useful when you overlay it on normal price structure. The institutional zones should improve chart context, not live in a separate universe.
Ask whether this activity is building, fading, or recurring. A repeated zone usually matters more than a fresh single-session spike with no context.
This is one of the best uses of dark pool data. If several names look similar technically, institutional context can help rank which ones deserve more focus.
Dark pool data should improve your process, not replace charting, catalyst awareness, or risk management.
There are really two good ways to approach dark pool data.
DarkPoolHeatmap.com is a great free starting point when you want to scan sectors quickly, identify elevated names, and see where off-exchange participation is clustering.
MobyTick Trading is the deeper workflow when you want broader coverage, historical dark pool research, repeated price-level analysis, and stronger ticker-level context.
That split matters because not every trader needs the full premium workflow on day one. But almost every trader benefits from seeing where the meaningful activity is first.
Dark pool data is not mystical, and it is not useless.
Used well, it gives retail traders a better view of where large participants were active, whether current flow is unusual, and which levels deserve more respect in a chart-based workflow.
Used badly, it turns into dramatic storytelling around one print and a lot of fake conviction.
If you want the fast, free starting point, use DarkPoolHeatmap.com to scan sectors and active names.
If you want deeper historical research, stronger institutional context, and a full workflow around dark pool activity, use MobyTick Trading.
That is the version of dark pool data that actually helps.
To make the term “dark pool data” more concrete, the chart below plots the top reported dark pool names from 2026-04-10 using internal MobyTick flow data. This is the kind of snapshot that helps a trader understand where institutional participation was concentrated on a real session.
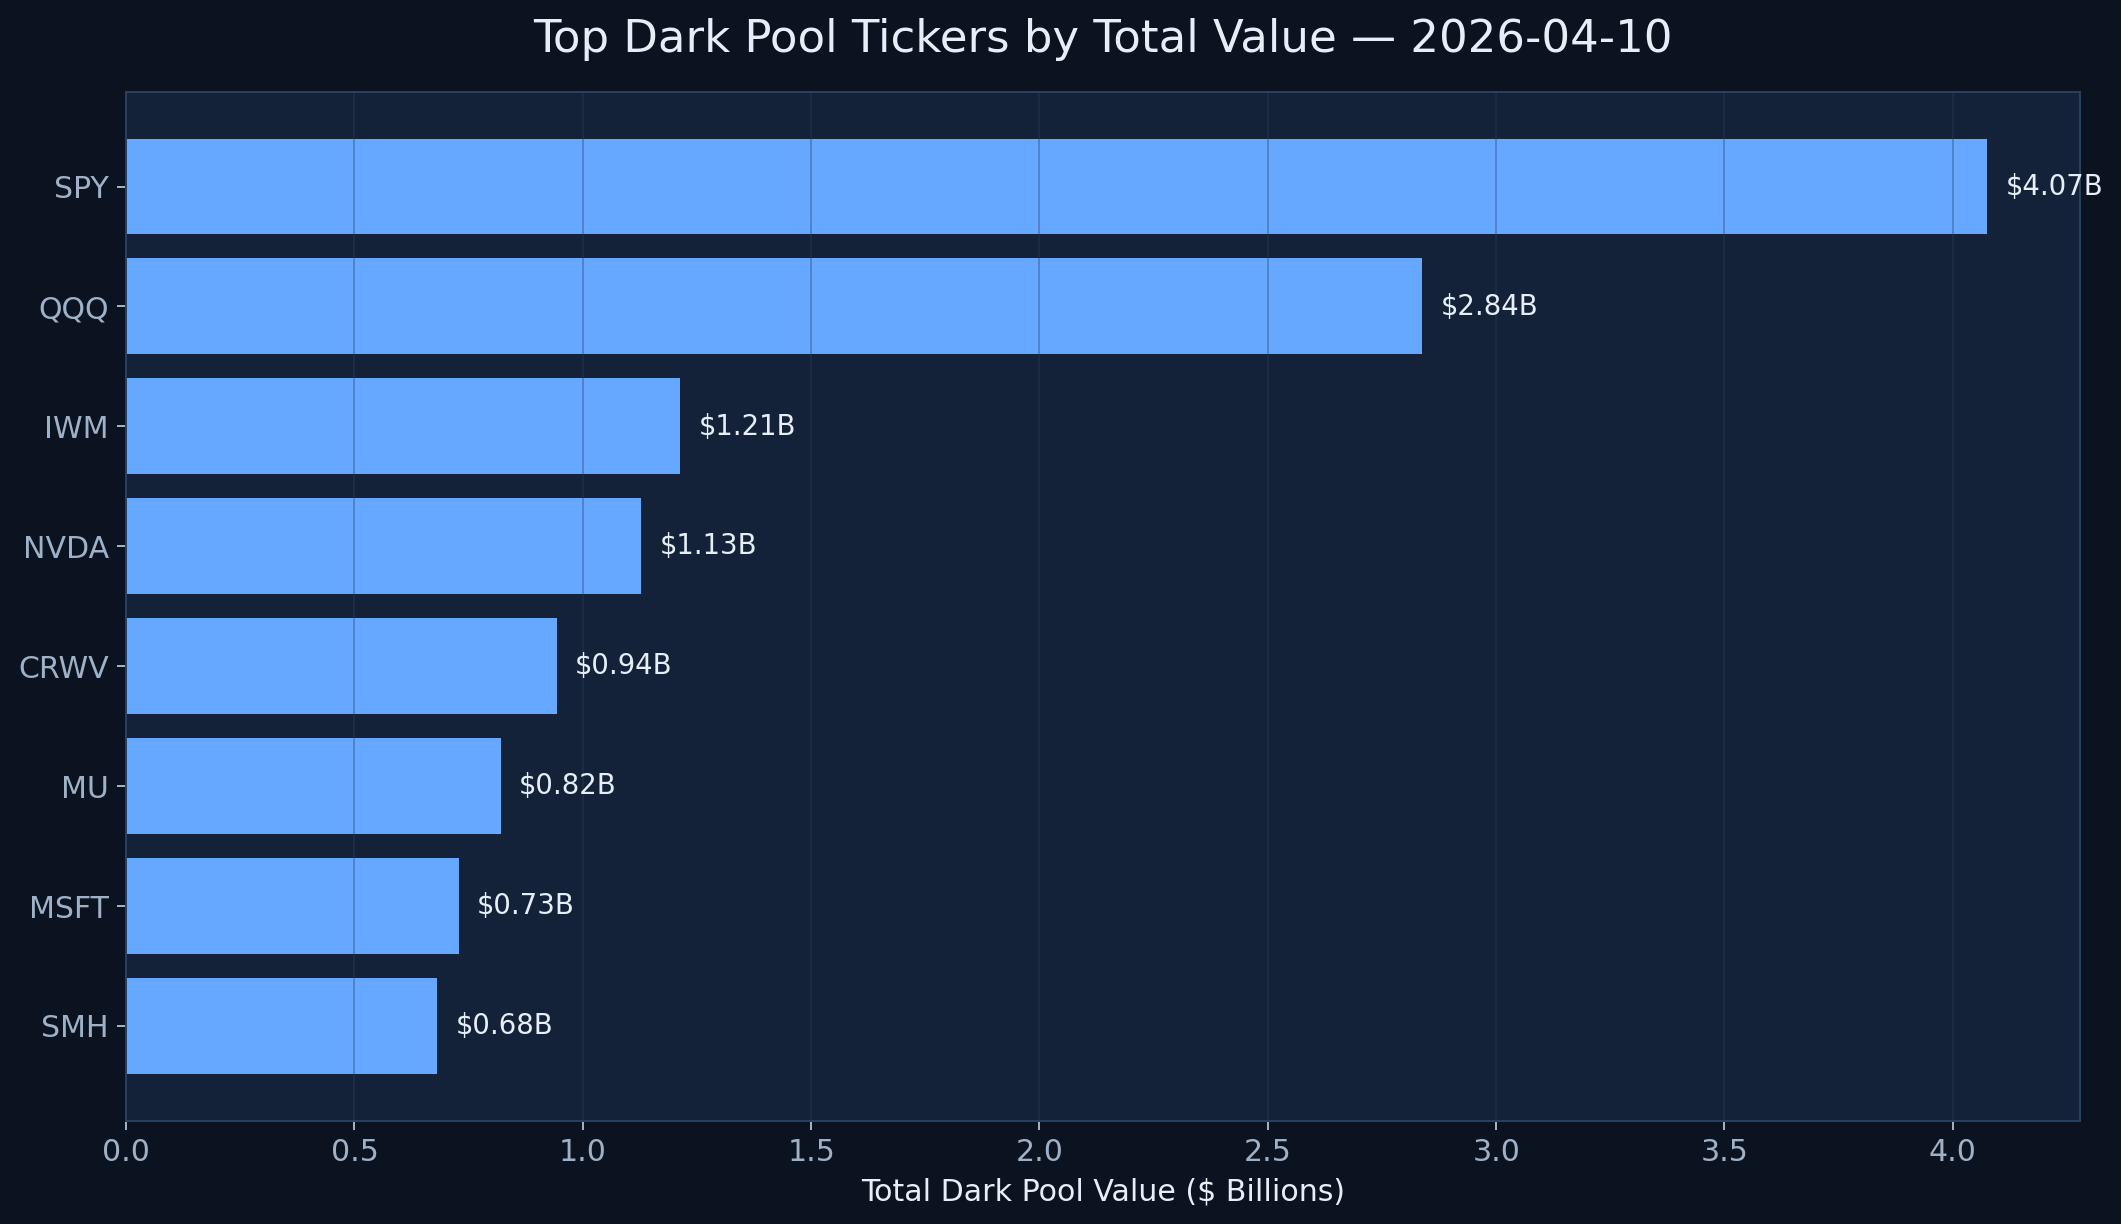
SPY alone printed about $4.07B, with QQQ at roughly $2.84B and IWM over $1.21B. That matters because it shows how often dark pool data is really about broad exposure and portfolio positioning, not just stock-specific stories. Then you get single-name concentration like NVDA at roughly $1.13B, which is where ticker-level analysis becomes more useful.
This is also why dark pool data needs explanation instead of mystique. The data becomes more useful when you can separate ETF-level positioning, sector-level participation, and single-stock concentration instead of treating every large print as the same kind of signal.