Physical Address
304 North Cardinal St.
Dorchester Center, MA 02124
Physical Address
304 North Cardinal St.
Dorchester Center, MA 02124

13 trade setups for July 27-31 2026. Dark pool intelligence from July 27–31.
Market data from the week of July 27–31, 2026. Trade setups for July 27-31 2026.
Crude ran the tape. Houthi militants claimed attacks on two Saudi tankers in the Red Sea mid-week, and Brent crossed $100/bbl for the first time since May. WTI futures jumped more than 5% Thursday to above $91. USO closed the week +10.27% — the largest move on our board by a wide margin.
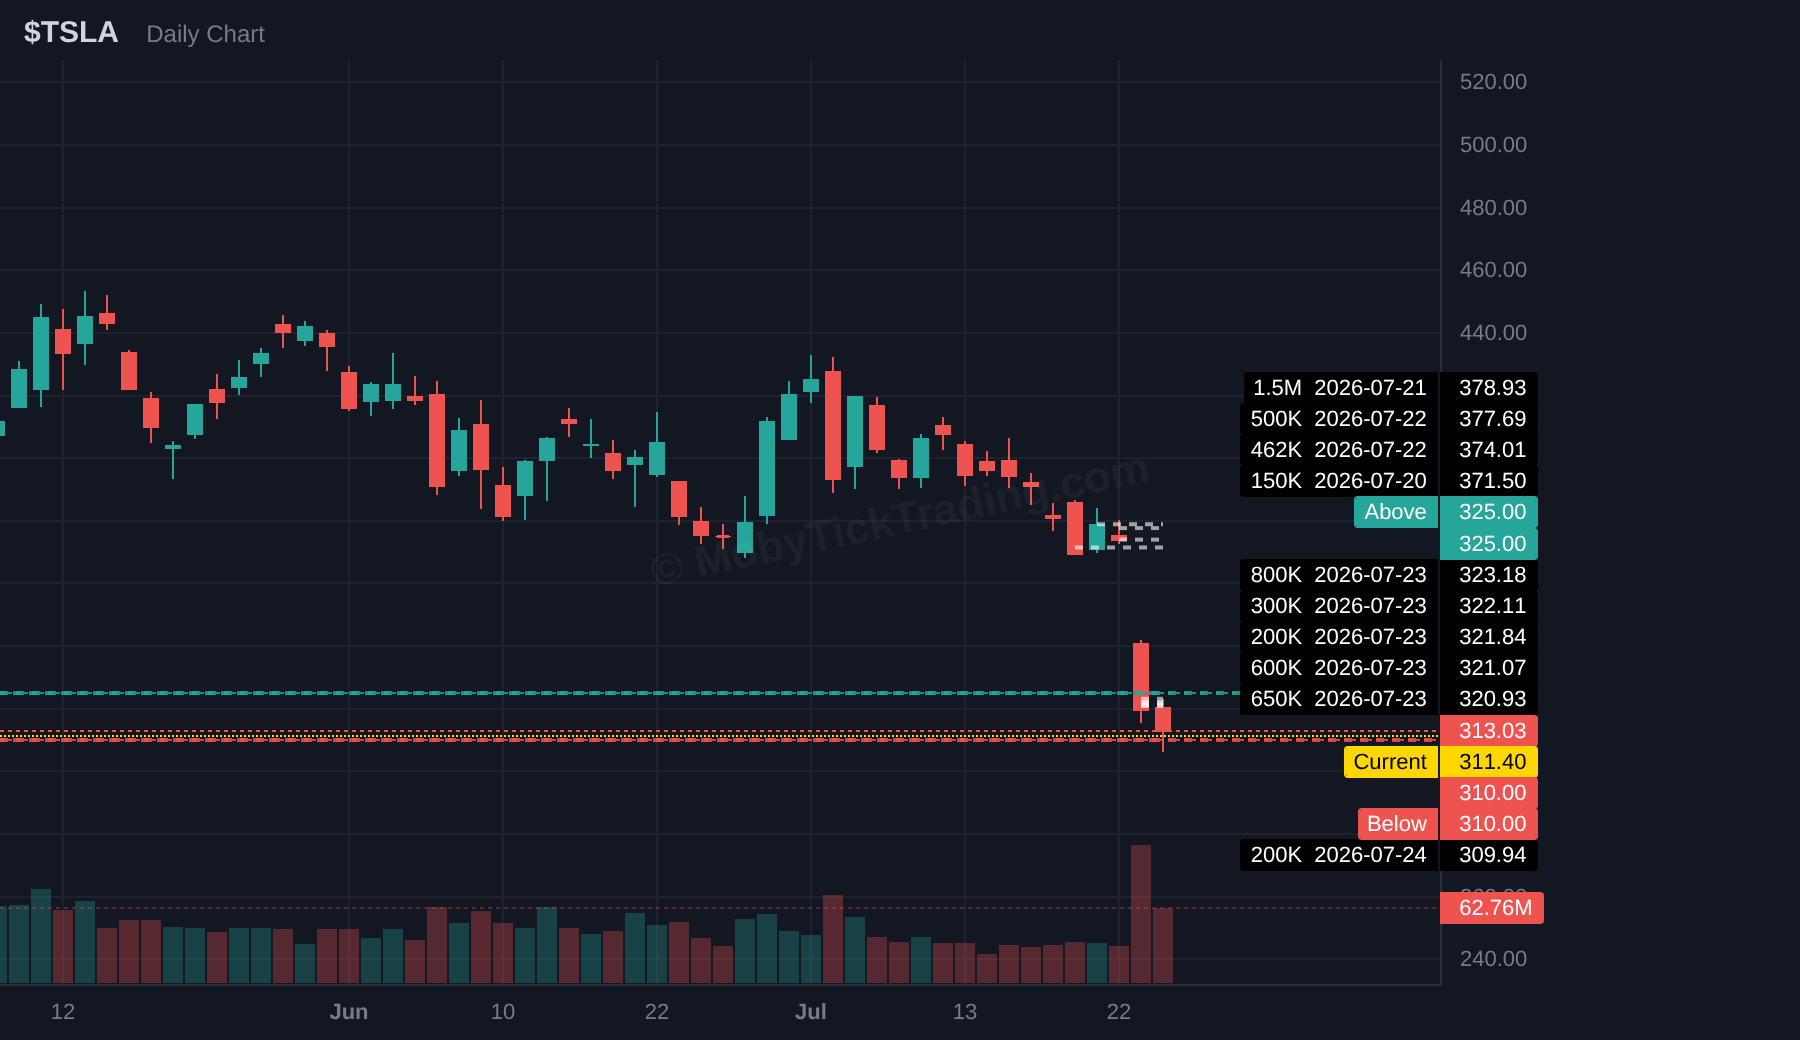
Then Thursday happened. Alphabet beat expectations and fell ~7% anyway. Tesla missed on profit as AI spending climbed and dropped ~14%. The S&P 500 gave up 1.21% to 7,408.30 in that single session, and the VIX printed an intraday 20.31 after closing Wednesday at a weekly low of 16.64. It settled the week at 18.58 — net flat, all the drama compressed into one day.
Rates did not cooperate. The 10Y climbed every session, 4.598% Monday to 4.679% Friday (+13.8 bp), its highest level of the year. The fuel: initial jobless claims fell to 187,000, a 57-year low, from 209,000 prior. The four-week average dropped to 207,500, so that print wasn’t noise.
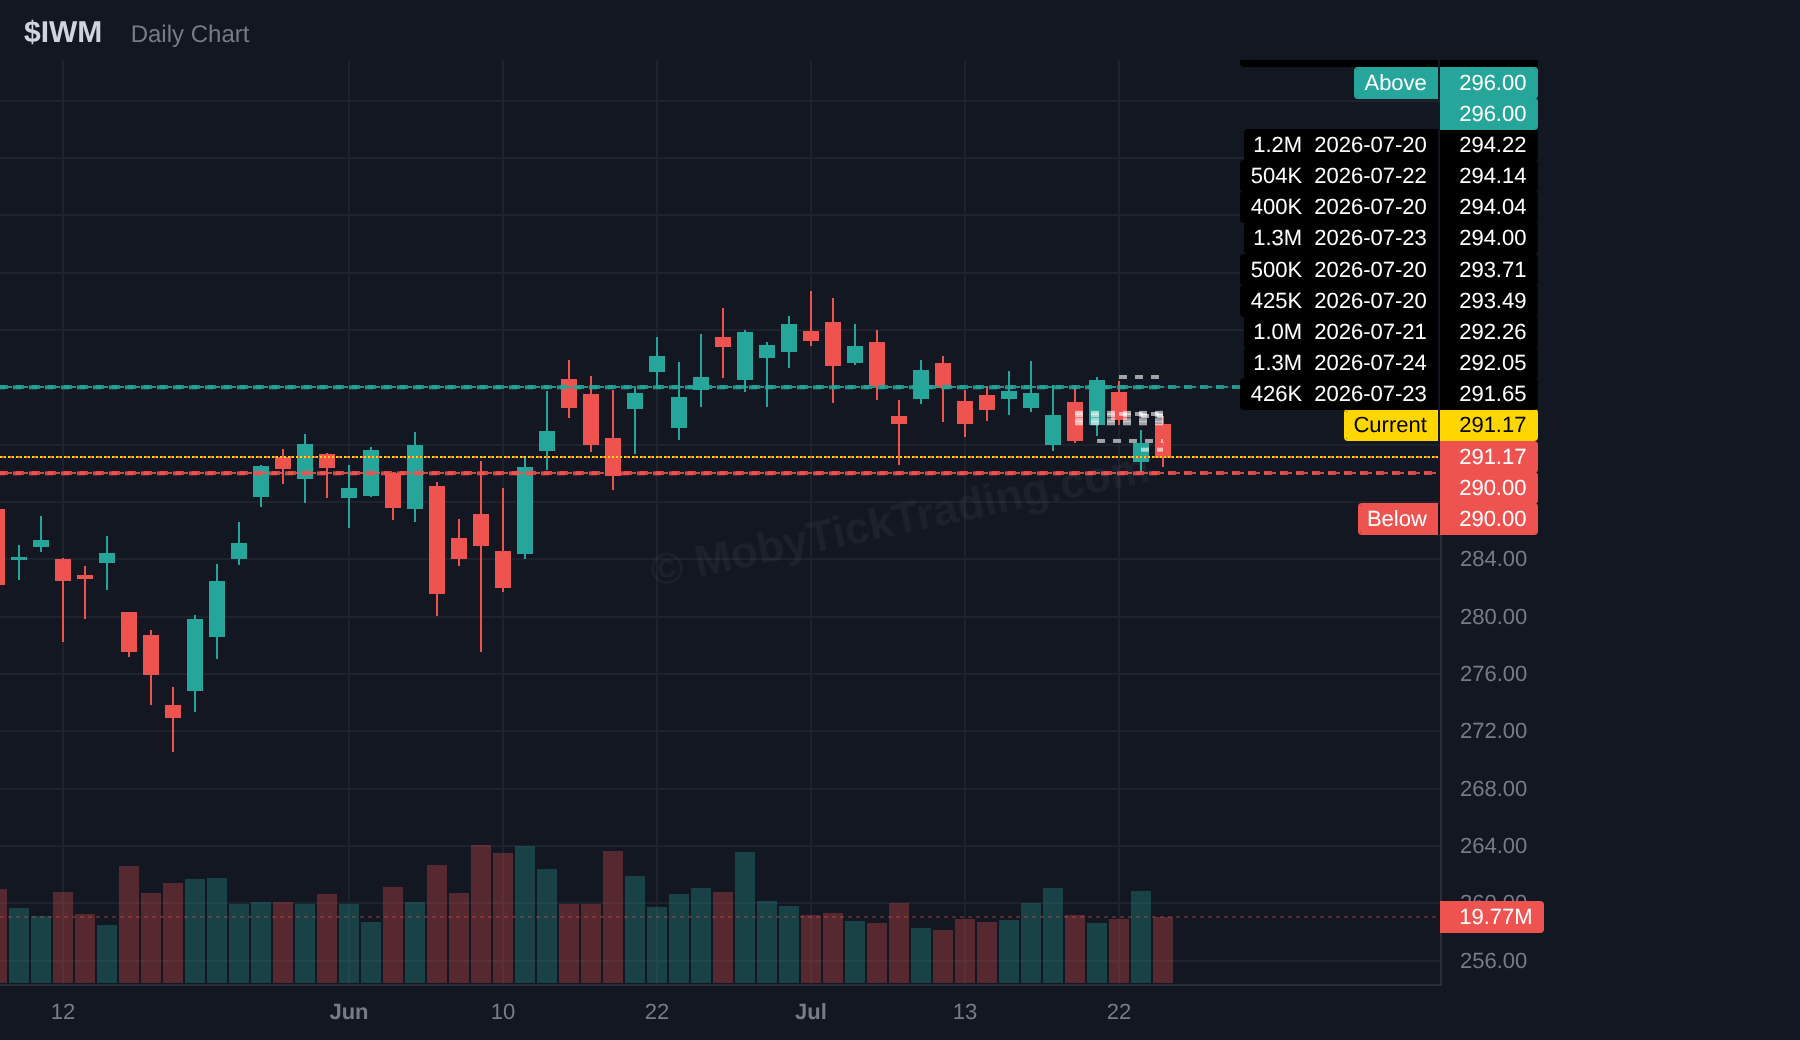
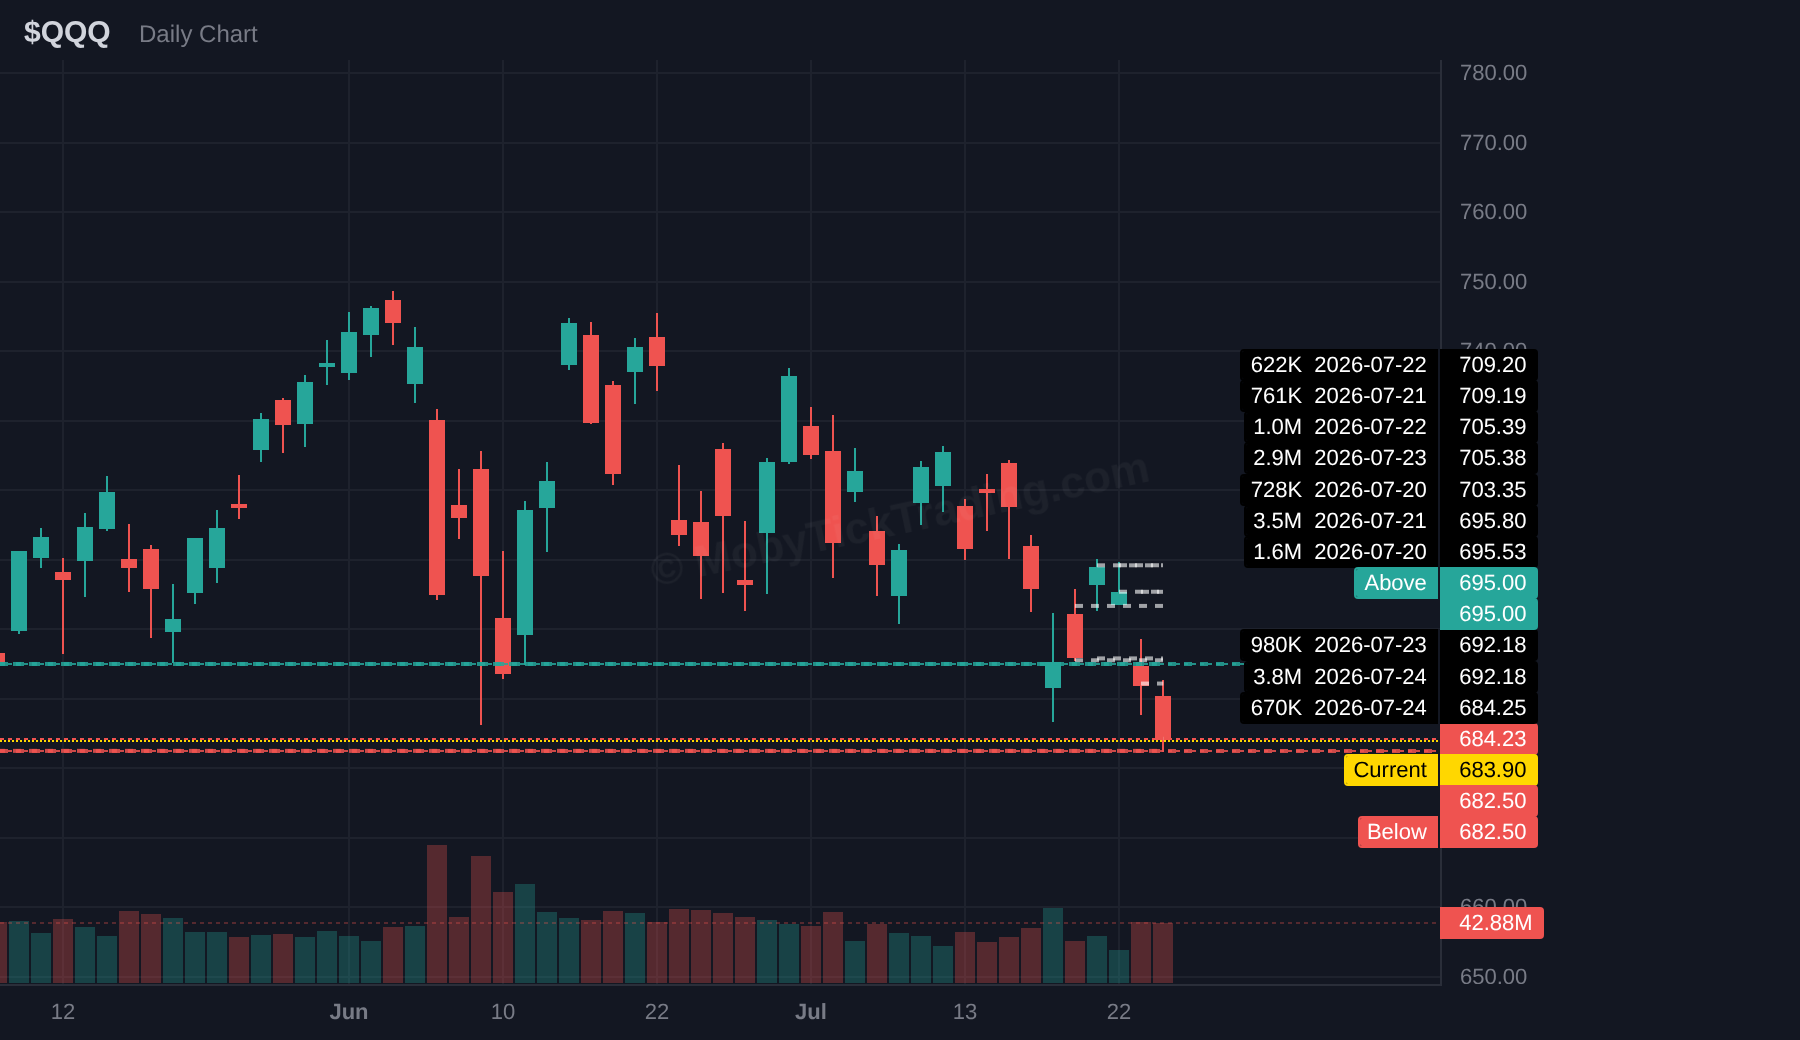
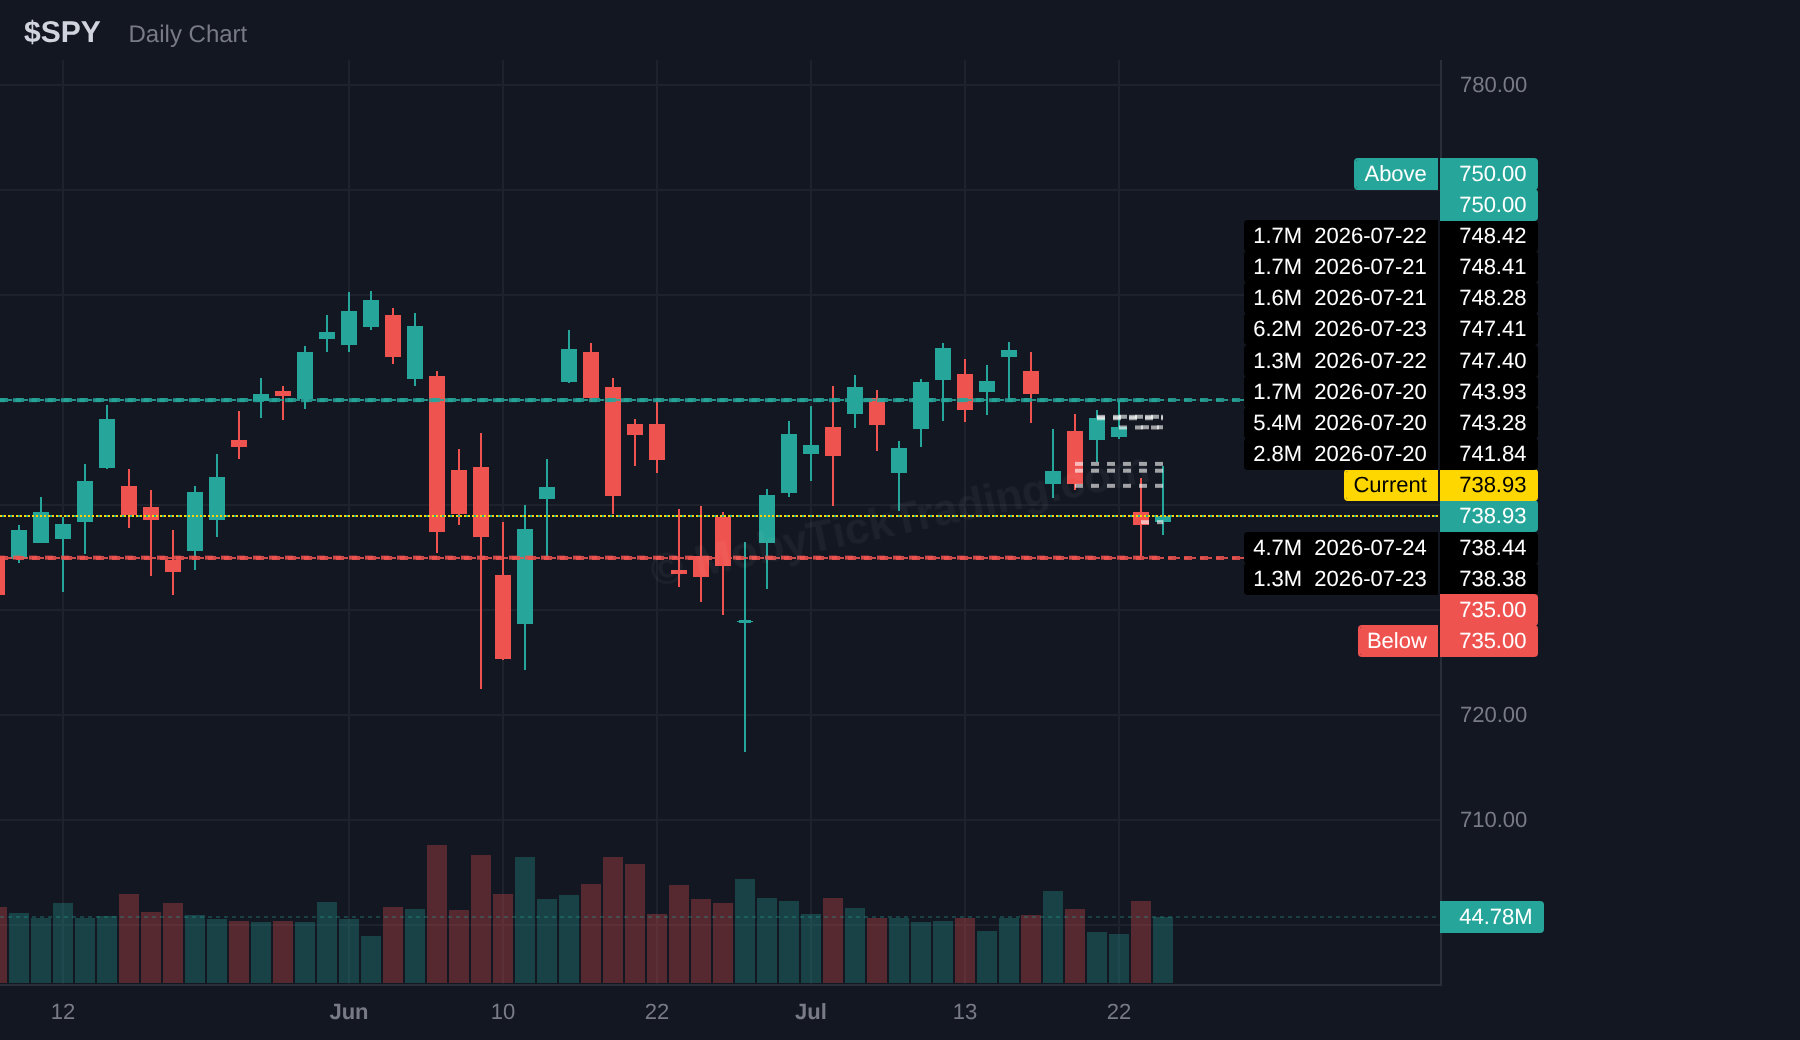
Index closes: SPY 738.93 (−0.59%), QQQ 684.23 (−1.60%), IWM 291.17 (−0.98%).
The damage was narrower than headlines implied. 8 of 11 sectors closed higher. Energy led at +3.36%, followed by Utilities +2.48% and Industrials +1.81%. The three decliners were Consumer Discretionary (−5.22%), Communication Services (−3.93%) and Consumer Staples (−1.24%) — and the first two took nearly all of it Thursday, the ETFs holding Tesla and Alphabet respectively. Broad Technology finished +0.17%. XLF ended +0.09%. Read that again: QQQ dropped 1.60% while the tech sector ETF was flat. This was a two-stock event, not a sector rotation.
Seven tickers reached at least one profit target for a total of 19 targets hit. Five Above levels triggered, four Below levels triggered, four never activated.
The standouts:
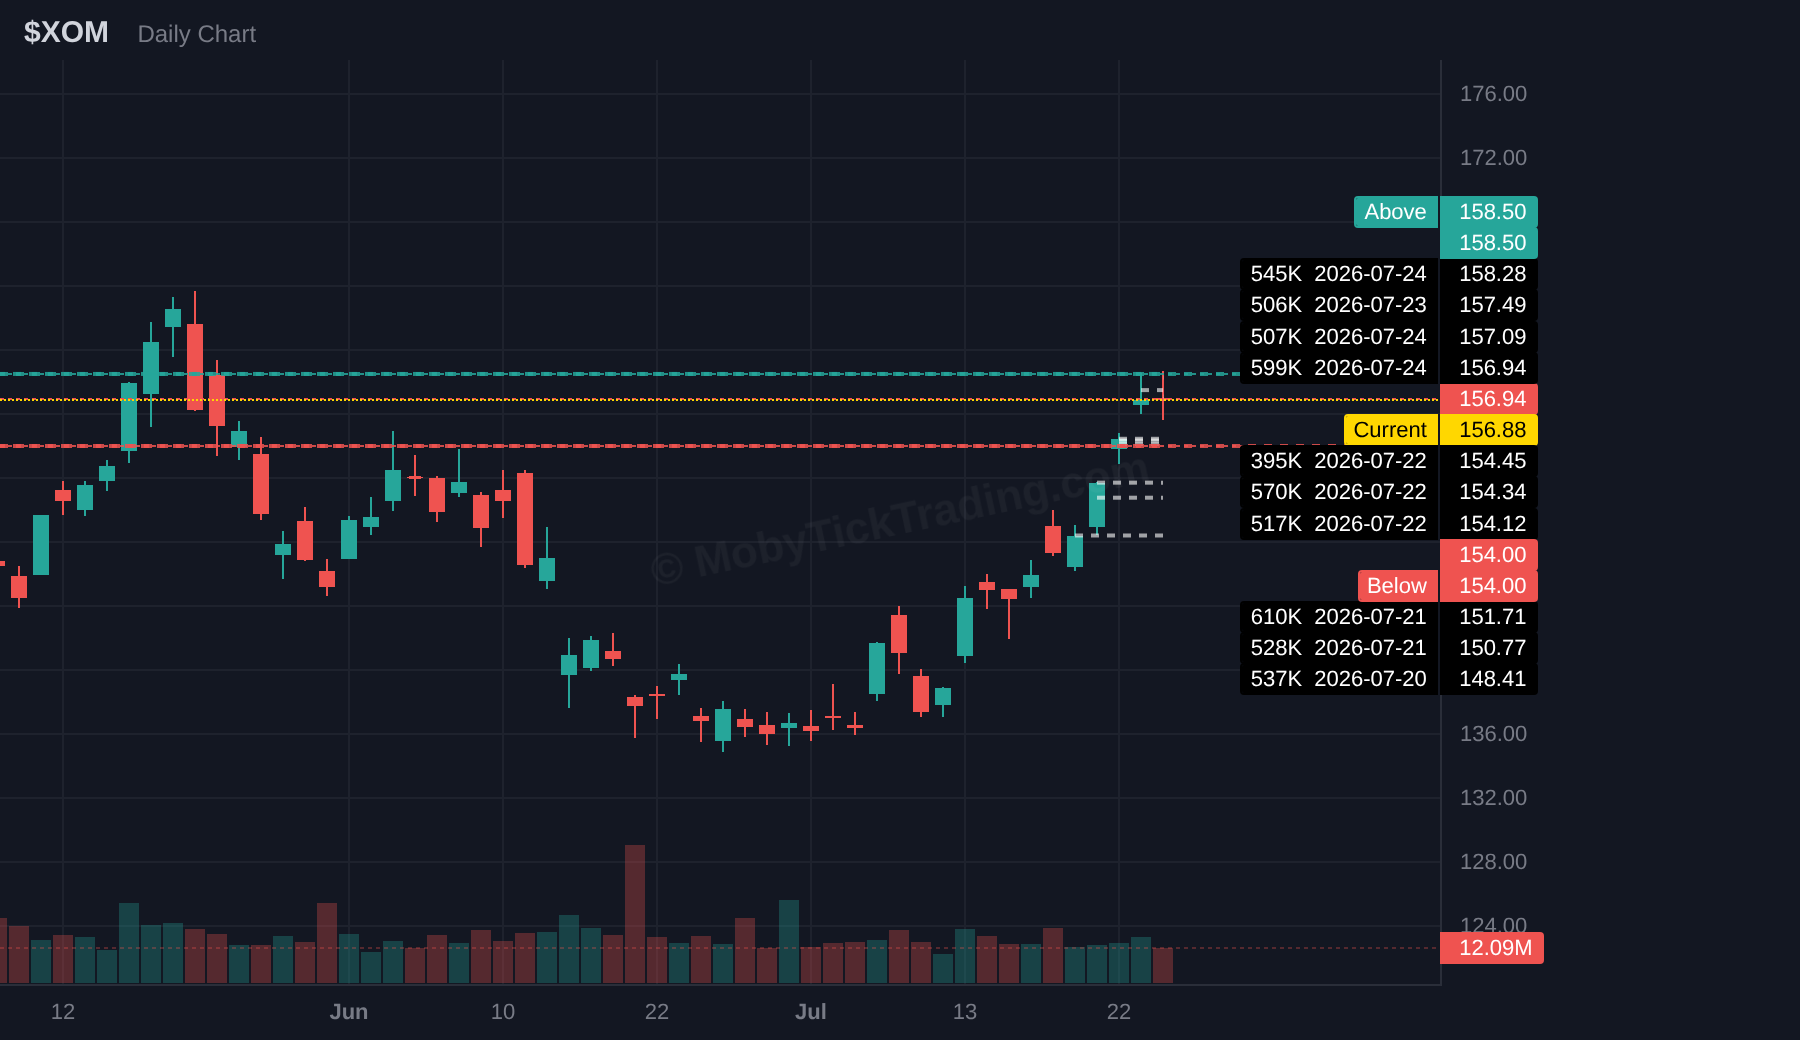
• XOM — Above $151.00 triggered, ran to $158.71 for +5.11%, tagging T3
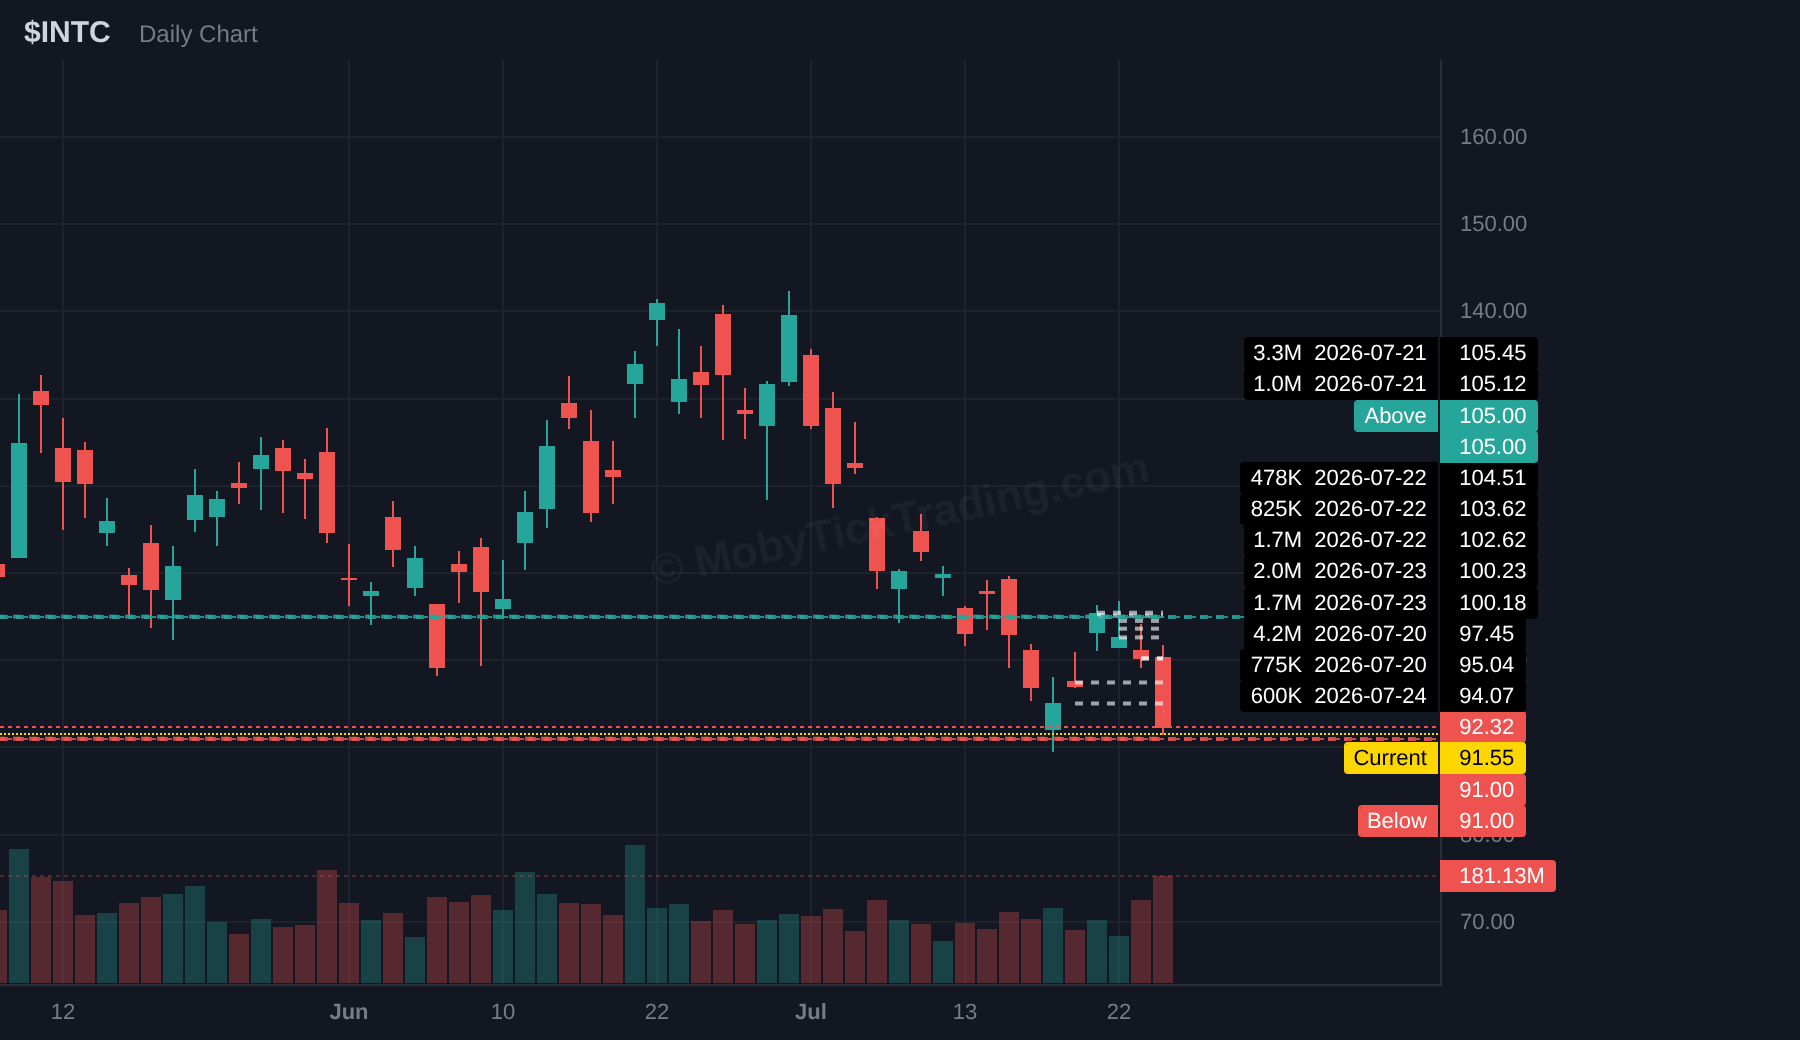
• INTC — Above $100.00 triggered, high of $106.85, +6.85% through T1
• FCX — Above $60.00 triggered, high of $65.43, +9.05% through T3
• GOOGL — Below $340.00 triggered, low of $314.90, −7.38%, full run to T5 (5 of 5)
• TSLA — Below $374.00 triggered, low of $306.51, −18.05%, all four downside targets
• QQQ — Above $702.50 triggered, high of $710.05, T2
Both sides of the book paid.
$19.1B crossed the broad-market ETF complex — SPY, QQQ, IWM, VOO, IVV — across 695 total prints logged for the week. SPY alone accounted for $9.88B on 20 prints.
In individual names, NVDA led at $4.5B (21.64M shares, 26 prints) with AAPL right behind at $4.4B (13.64M shares, 15 prints).
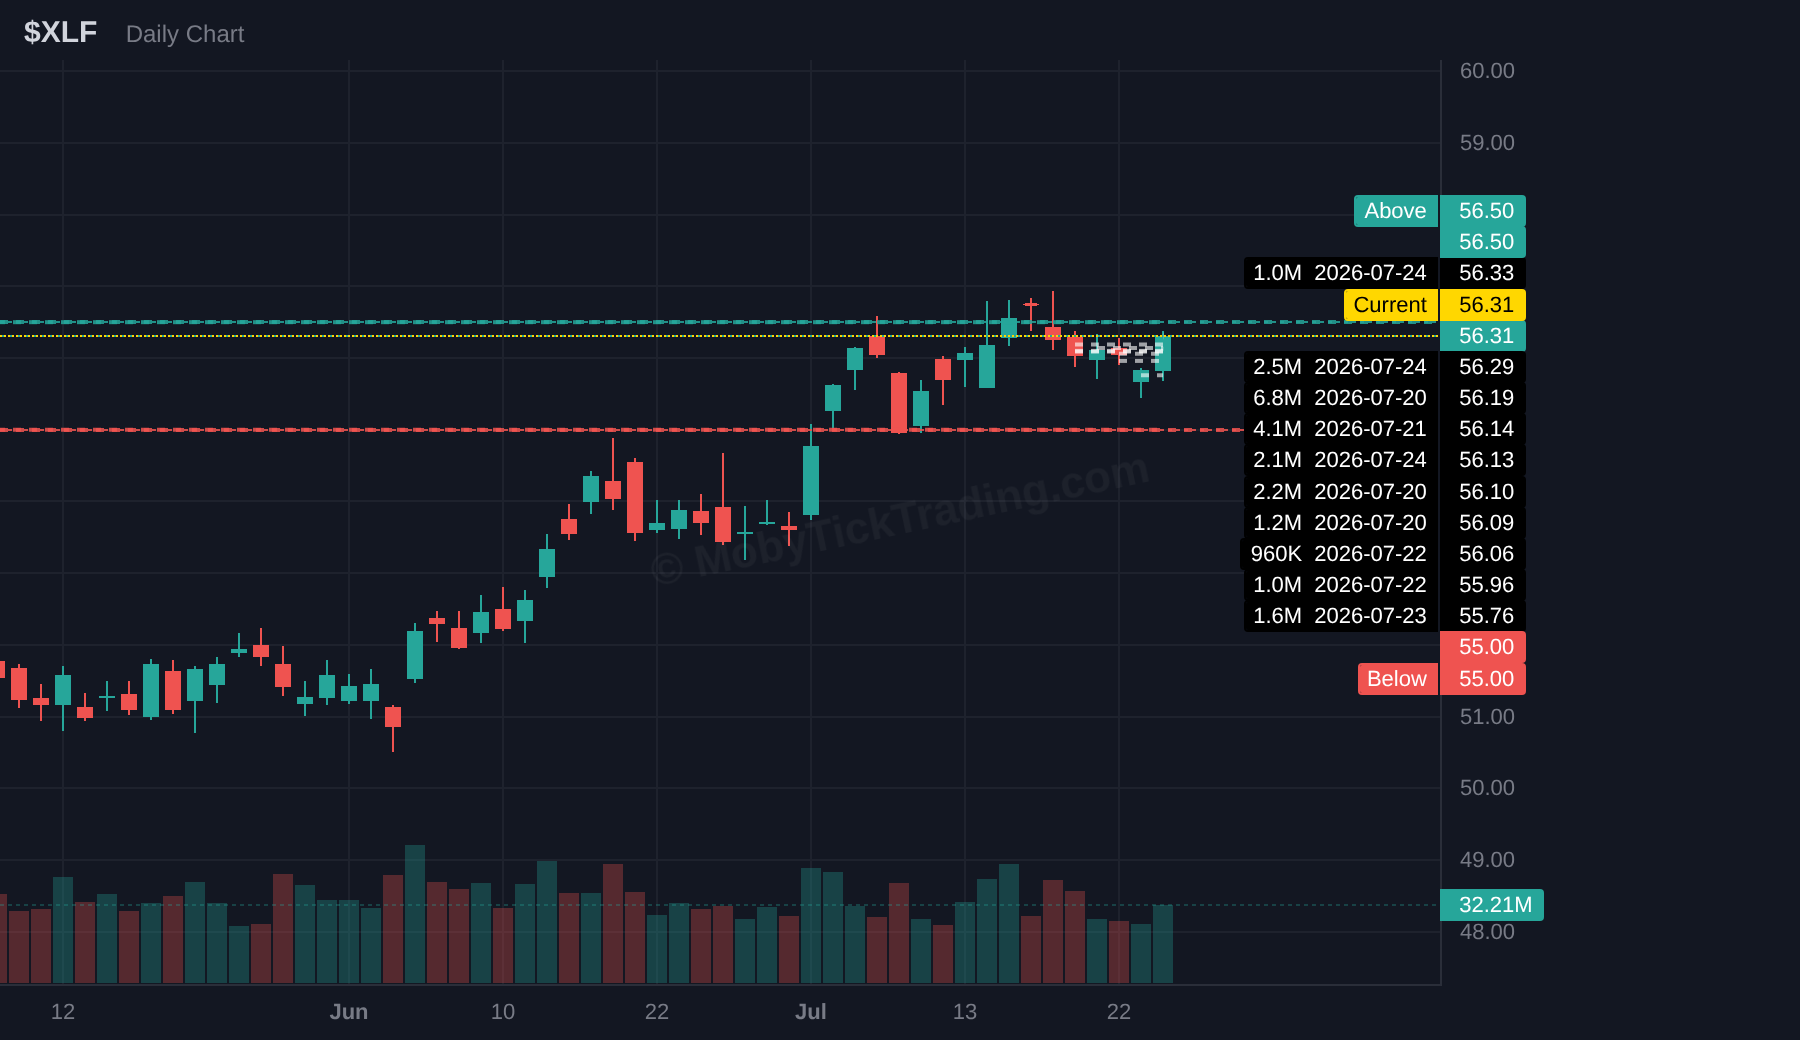
Sector ETFs saw $2.7B total, and XLF led at $1.47B — 26.21M shares across 15 prints, the most print activity of any sector fund. Worth noting given XLF’s flat weekly close.
FOMC, Tuesday and Wednesday (Jul 28–29). No decision came last week, which is why every Friday wrap read like a waiting room. Markets are assigning roughly 34% odds to a hike, up materially on the 187K claims print, inflation at 3.7%, and Brent above $100.
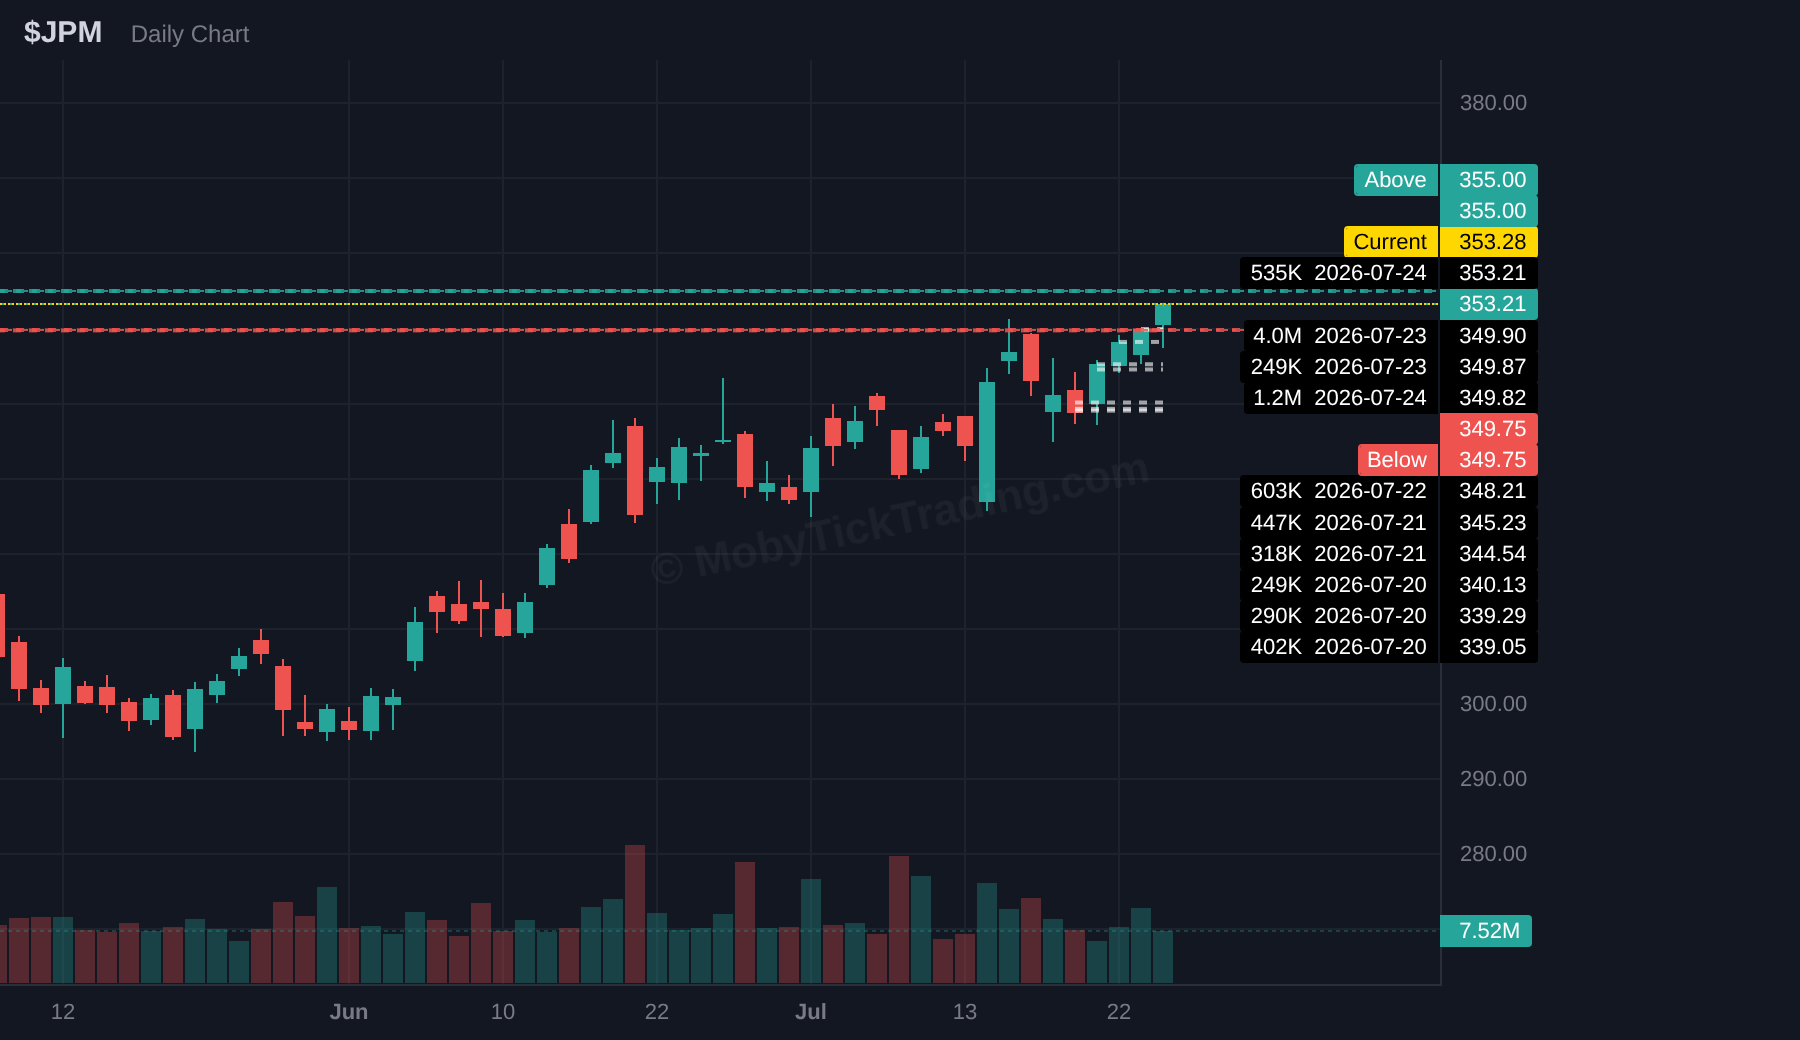
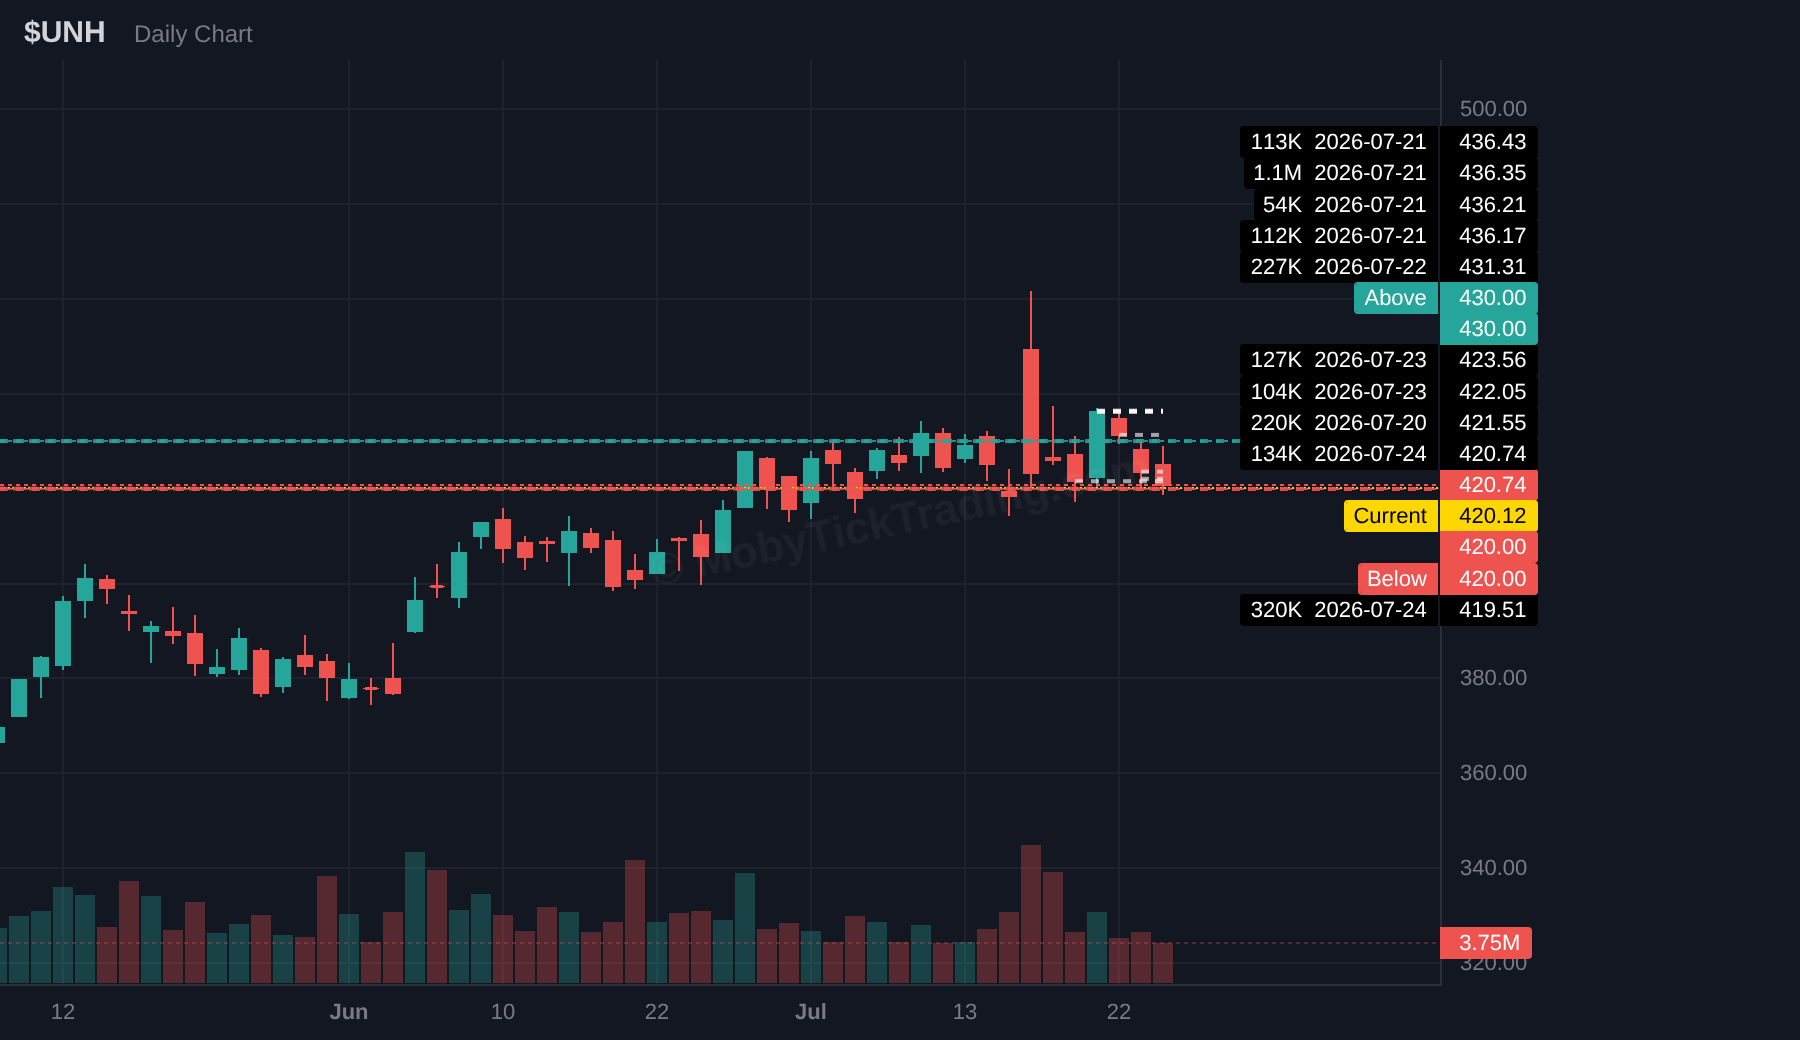
Thirteen tickers on the board: SPY, QQQ, IWM, XLF, AAPL, AMZN, XOM, TSLA, JPM, INTC, EWY, HOOD, UNH. Six are new this week — XLF, AMZN, JPM, EWY, HOOD and UNH. Two of those (XLF, JPM) sit in the sector that just absorbed the heaviest dark pool flow of the week, and JPM itself logged $1.86B in prints.
Levels are set. Let the tape come to you.
*Data sourced from MobyTick.*
| Ticker | Above | Below | High | Low | Close | Triggered | Targets Hit | Move From Trigger |
|---|---|---|---|---|---|---|---|---|
| SPY | $751.00 | $740.00 | $750.02 | $735.21 | $738.93 | Below | 0 of 6 | $740.00 → $735.21 (−0.65%) |
| QQQ | $702.50 | $686.00 | $710.05 | $682.48 | $684.23 | Above | 2 of 7 → T2 ($710.00) | $702.50 → $710.05 (+1.07%) |
| IWM | $298.00 | $290.00 | $296.75 | $290.17 | $291.17 | Not triggered | Not triggered | — |
| NVDA | $215.00 | $197.50 | $214.39 | $202.28 | $206.84 | Not triggered | Not triggered | — |
| XOM | $151.00 | $144.50 | $158.71 | $146.23 | $156.94 | Above | 3 of 7 → T3 ($157.50) | $151.00 → $158.71 (+5.11%) |
| INTC | $100.00 | $89.50 | $106.85 | $91.58 | $92.32 | Above | 1 of 7 → T1 ($105.00) | $100.00 → $106.85 (+6.85%) |
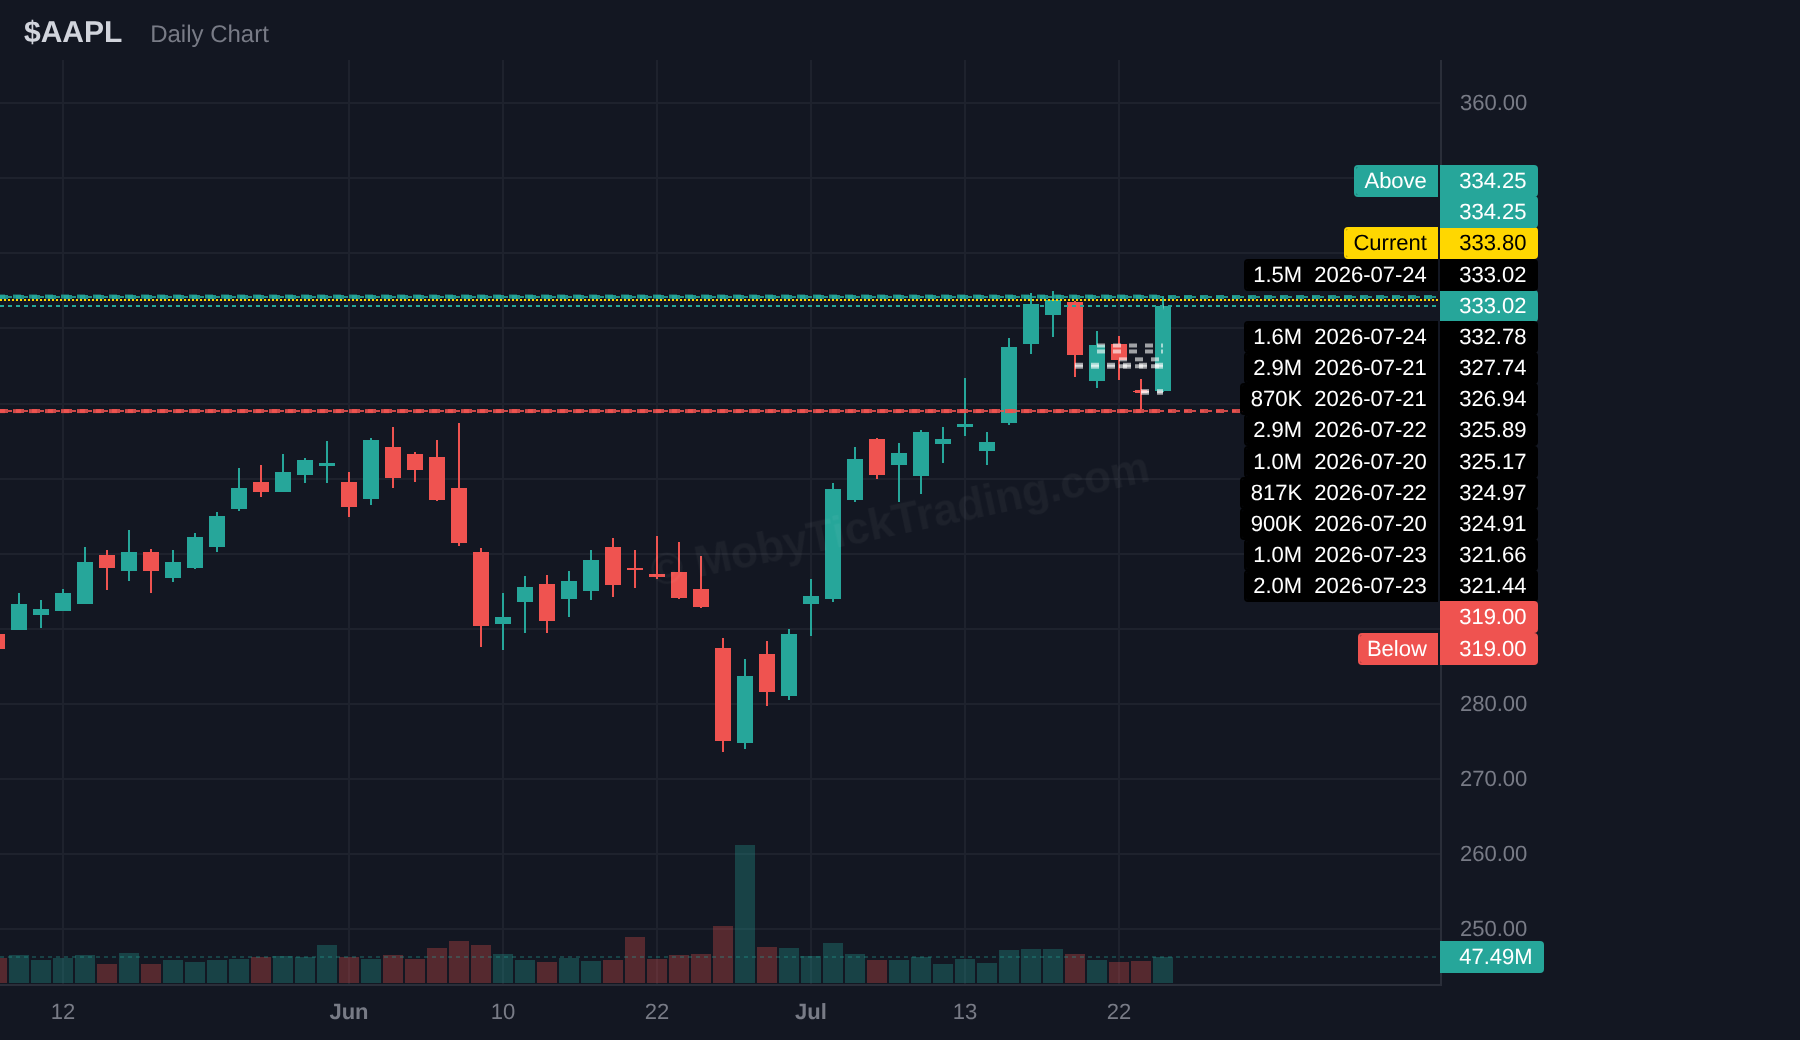
| AAPL | $335.00 | $313.00 | $334.37 | $319.35 | $333.02 | Not triggered | Not triggered | — |
| GOOGL | $360.00 | $340.00 | $359.68 | $314.90 | $319.74 | Below | 5 of 5 → T5 ($320.00) | $340.00 → $314.90 (−7.38%) |
| TSLA | $390.00 | $374.00 | $386.61 | $306.51 | $313.03 | Below | 4 of 4 → T4 ($340.00) | $374.00 → $306.51 (−18.05%) |
| SPCX | $140.00 | $122.00 | $129.88 | $110.85 | $115.07 | Below | 1 of 6 → T1 ($120.00) | $122.00 → $110.85 (−9.14%) |
| ACN | $147.50 | $135.00 | $147.53 | $135.96 | $146.99 | Above | 0 of 5 | $147.50 → $147.53 (+0.02%) |
| FCX | $60.00 | $56.00 | $65.43 | $58.52 | $62.60 | Above | 3 of 6 → T3 ($65.00) | $60.00 → $65.43 (+9.05%) |
| PFE | $26.00 | $24.00 | $25.19 | $24.51 | $24.54 | Not triggered | Not triggered | — |
Tally: Above triggered: 5 · Below triggered: 4 · Not triggered: 4
Targets: Tickers reaching ≥1 target: 7 · Total profit targets hit: 19
New tickers this week (no prior callout): XLF, AMZN, JPM, EWY, HOOD, UNH
*Data sourced from MobyTick.*
| Ticker | Above | T1 | T2 | T3 | T4 | T5 | T6 |
|---|---|---|---|---|---|---|---|
| SPY | $750.00 | $755.00 | $757.00 | $760.00 | $765.00 | $760.00 | $770.00 |
| QQQ | $695.00 | $700.00 | $705.00 | $710.00 | $715.00 | $720.00 | $725.00 |
| IWM | $296.00 | $297.50 | $300.00 | $302.50 | $305.00 | $307.50 | $310.00 |
| XLF | $56.50 | $57.50 | $58.25 | $60.00 | $61.25 | $62.50 | — |
| AAPL | $334.25 | $337.50 | $340.00 | $342.50 | $345.00 | $350.00 | — |
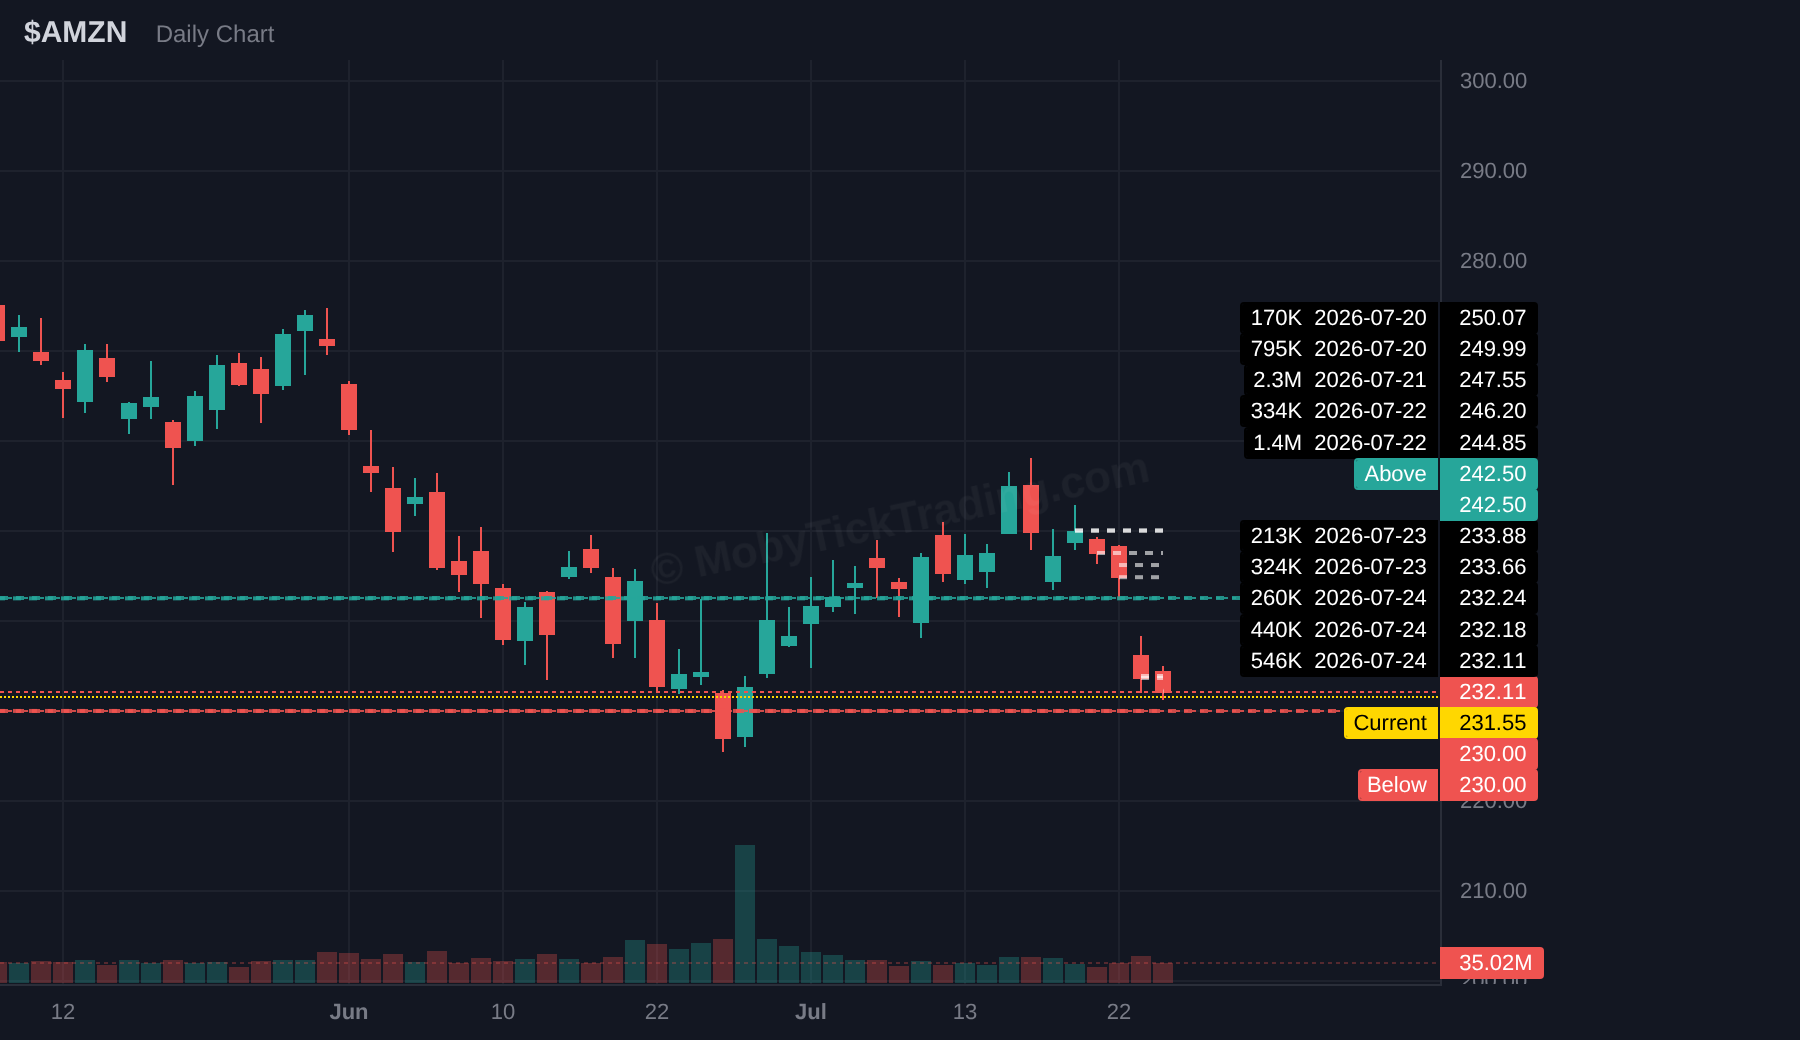
| AMZN | $242.5 | $245 | $247.50 | $250 | $255 | $260 | — |
| XOM | $158.5 | $160 | $162.5 | $165 | $167.5 | $170 | — |
| TSLA | $325 | $340 | $350 | $360 | $374 | — | — |
| JPM | $355 | $360 | $362.5 | $365 | $367.5 | $370 | $375 |
| INTC | $105 | $110 | $120 | $130 | $140 | — | — |
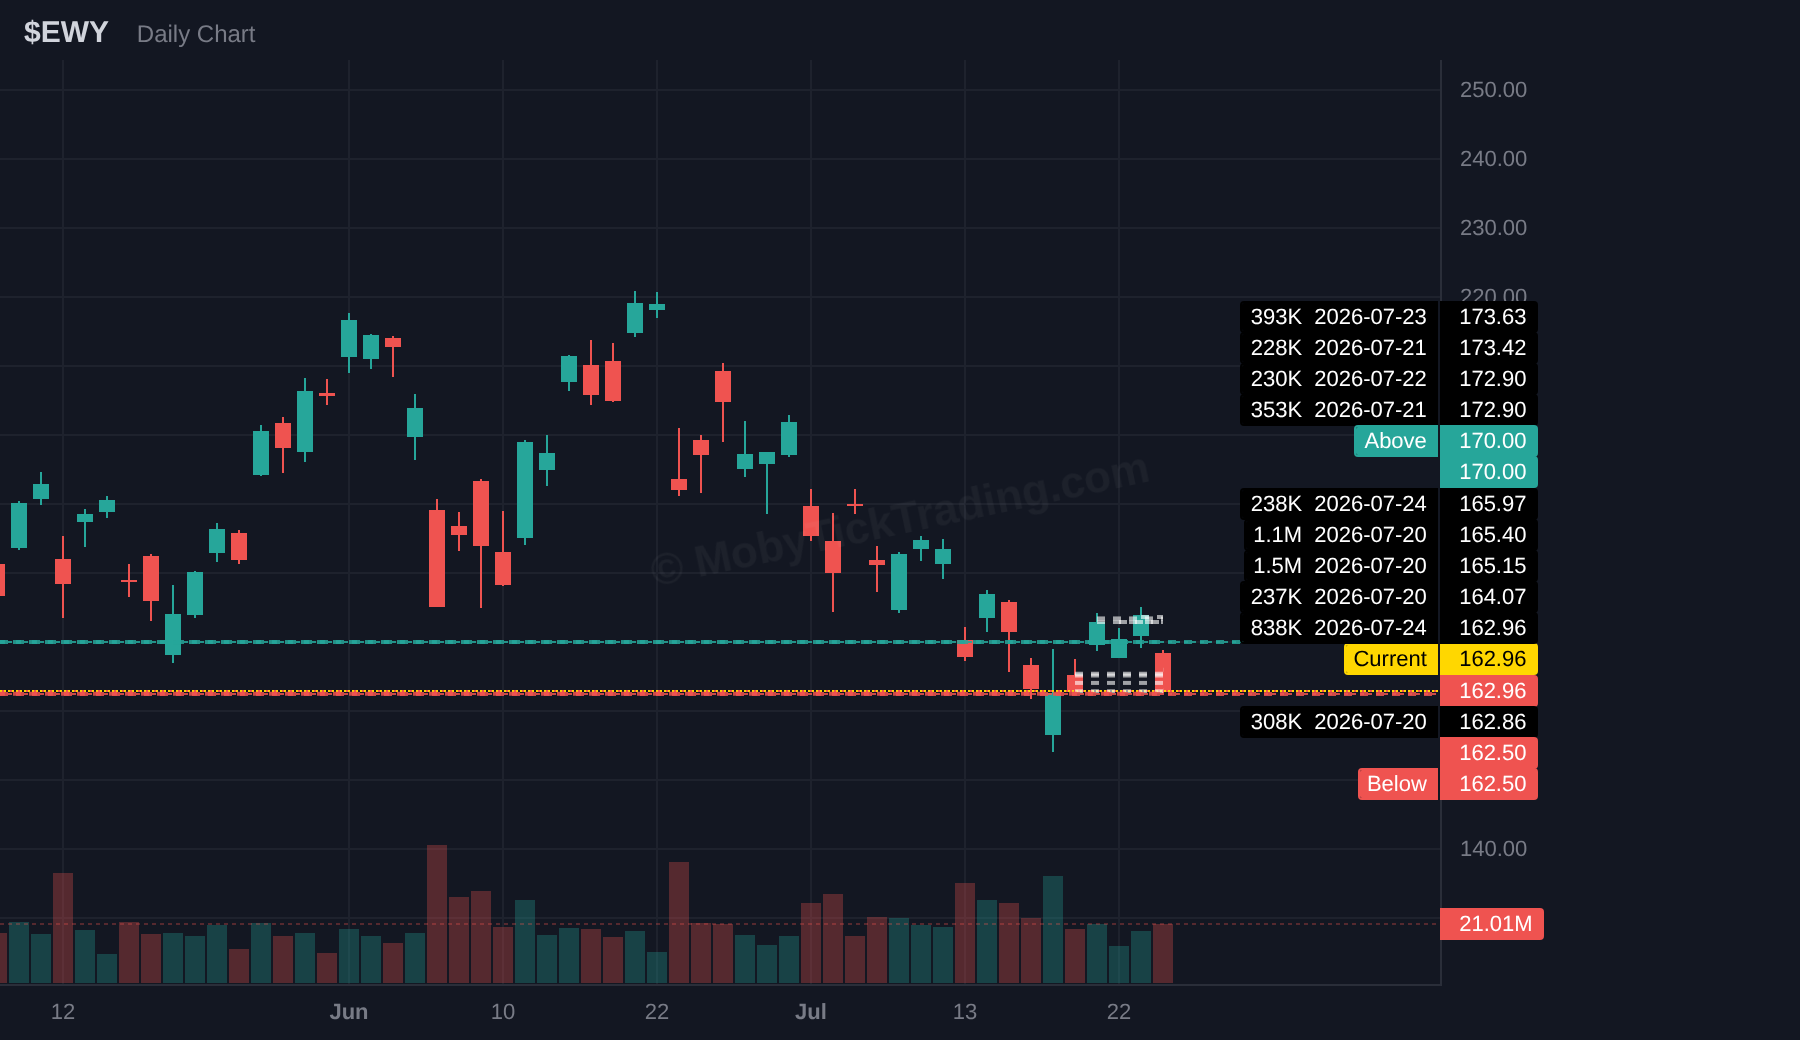
| EWY | $170 | $172.5 | $175 | $177.5 | $180 | $185 | $190 |
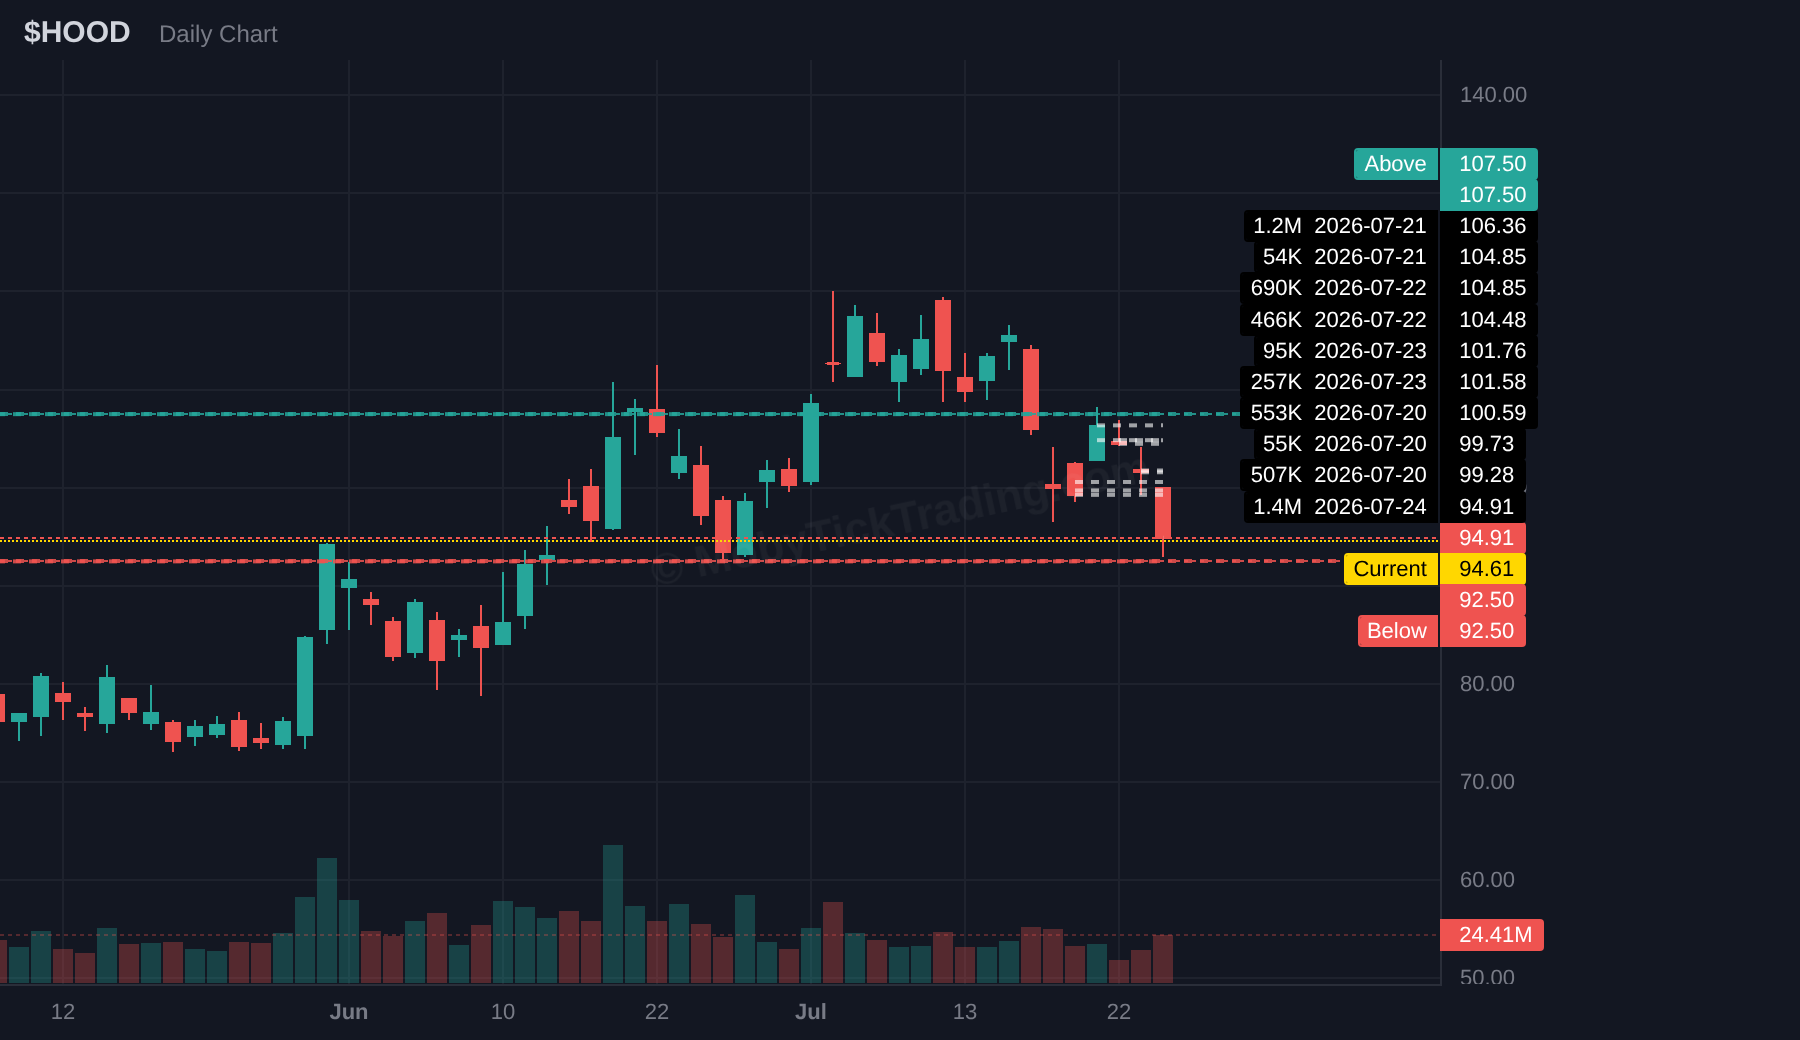
| HOOD | $107.50 | $110 | $115 | $118.5 | $120 | $125 | $130 |
| UNH | $430 | $435 | $440 | $445 | $450 | $460 | — |
| Ticker | Below | T1 | T2 | T3 | T4 | T5 | T6 | T7 |
|---|---|---|---|---|---|---|---|---|
| SPY | $735.00 | $732.50 | $730.00 | $725.00 | $720.00 | $715.00 | $712.50 | — |
| QQQ | $682.50 | $672.50 | $665.00 | $660.00 | $650.00 | $640.00 | — | — |
| IWM | $290.00 | $287.50 | $285.00 | $282.00 | $280.00 | $277.50 | $275.00 | $272.50 |
| XLF | $55.00 | $54.00 | $53.50 | $52.00 | $51.50 | — | — | — |
| AAPL | $319.00 | $317.50 | $315.00 | $310.00 | $300.00 | $290.00 | — | — |
| AMZN | $230 | $227.5 | $225 | $220 | $215 | $210 | — | — |
| XOM | $154 | $152.5 | $150 | $147.5 | $145 | — | — | — |
| TSLA | $310 | $300 | $282.5 | $265 | $250 | — | — | — |
| JPM | $349.75 | $345 | $340 | $337.5 | $335 | $332.5 | $330 | — |
| INTC | $91 | $85 | $81 | $75 | $70 | $65 | — | — |
| EWY | $162.50 | $160 | $155 | $150 | $140 | $133.5 | — | — |
| HOOD | $92.5 | $90 | $87.50 | $85 | $80 | $75 | $70 | — |
| UNH | $420 | $416 | $411 | $407.5 | $405 | $400 | $398 | $300 |
Broad market: $19.1B across five vehicles.
Dark pool flow in the major index ETFs totaled $19.06B for the week of Jul 20–24. SPY carried the load with $9.88B across 20 prints (13.3M shares, $742.85 average price) — 52% of all broad-market ETF flow by itself. Behind it: IVV $4.38B (6 prints), VOO $2.21B (6 prints), QQQ $1.93B (6 prints), and IWM $661.6M (5 prints).
Two single names outpaced everything except SPY. NVDA printed $4.50B across 26 blocks — the highest print count in the entire dataset — at an average of $207.87. AAPL followed at $4.44B on 15 prints, average $325.86. Both cleared IVV. When individual equities absorb more block volume than the second-largest S&P vehicle, that’s a concentration signal worth logging.
Sector SPDRs: $2.7B, and it wasn’t spread evenly.
Total flow across the 11 sector ETFs came to $2.70B — roughly one-seventh of broad-market volume. XLF led at $1.47B on 15 prints (26.2M shares, $56.12 average), taking 54% of all sector flow on its own. XLE was a distant second at $467.1M (6 prints), then XLC at $387.2M (3 prints). Those three accounted for 86% of sector activity.
The bottom of the table is the story. XLV registered zero qualifying prints, as did XLI and XLRE. XLB ($27.7M), XLU ($29.5M), and XLY ($52.5M) each cleared on a single print. Eight of eleven sector ETFs were effectively invisible in the block tape.
Price action ran a different script.
XLE led performance at +3.36%, tracking the crude move, followed by XLU +2.48% and XLI +1.81%. XLY was the week’s worst at −5.22%, taking most of its damage Thursday on Tesla’s post-earnings drop, with XLC −3.93% close behind on Alphabet. 8 of 11 sectors closed higher — index-level weakness was concentrated, not broad.
The flag: XLF.
XLF pulled the most sector dark pool flow of the week and closed at +0.09% — flat. Over $1.4B in block volume changed hands with essentially zero price displacement. Dark pool prints don’t disclose which side initiated, so this isn’t a call on positioning. But size moving through a name that doesn’t move is the kind of divergence that usually resolves later, not never. XLF goes on the watchlist.
*Data sourced from MobyTick. 695 total prints captured Jul 20–24, 2026.*
Four of last week’s thirteen callouts — IWM, NVDA, AAPL, and PFE — never triggered Above or Below. New readers often read that as a miss. It isn’t. It’s a signal in its own right, and it’s one of the more useful ones we get.
Here’s the mechanic. Every callout brackets a ticker with two levels drawn from where institutional size actually printed. The Above level sits over the dark pool band; the Below level sits under it. When price closes the week *between* them, the read was correct: size accumulated inside a range, and the range held.
Look at AAPL. The band was $313 to $335. The week’s actual travel was $319.35 to $334.37 — a full week of trading that never escaped either side. Dark pool prints in AAPL averaged $325.86 across 15 prints worth $4.44B, essentially dead-center in that band. Price didn’t break out because institutions weren’t pushing it out; they were transacting inside it.
IWM is the tighter example. Below sat at $290.00. The week’s low was $290.17 — seventeen cents of daylight. That’s not luck, that’s the band doing its job as a boundary. NVDA did the same thing on both ends: $202.28 to $214.39 inside a $197.50/$215.00 bracket, with $4.5B in prints averaging $207.87.
Why this matters practically:
A “no trigger” week is a range read, not a dead week. Consolidation inside a dark pool band means the level structure is still valid. Nothing invalidated it.
It informs position sizing. Breakout entries have no edge until a trigger actually fires. Waiting costs you nothing; guessing costs you the trigger’s whole purpose.
It sharpens the next callout. AAPL’s new band this week is $334.25 / $319.00 — nearly identical to last week’s realized high and low. IWM’s Above tightened from $298.00 to $296.00. When a range holds, the band compresses around it, and compression is what makes the eventual trigger meaningful.
A trigger that doesn’t fire told you exactly what it was supposed to: not yet.
*Data sourced from MobyTick.*
Get institutional dark pool intelligence delivered weekly.
Start Your 7-Day Free Trial