Market Overview: A Recovery Week, Capped by a Historic IPO
After the prior week’s payroll-driven selloff and the June 5 semiconductor washout, the week of June 8–12 turned into a recovery, capped by a powerful Friday rally. The major averages clawed back ground and finished higher across the board, with small caps and semiconductors leading the rebound.
For the week, the S&P 500 (SPY) added roughly +0.6%, the Nasdaq 100 (QQQ) gained +2.3%, the Dow rose about +0.7%, and the Russell 2000 (IWM) was the standout at +4.0%. The VanEck Semiconductor ETF (SMH) surged nearly +9%, recovering most of the prior Friday’s near-10% plunge. Volatility deflated — the VIX fell from 21.51 to close at 17.68, down about 18% on the week.
The Three Catalysts
- Geopolitics turned constructive: reports of a potential peace framework that would ease tensions and reopen the Strait of Hormuz took the war premium out of oil, which eased about 2% back toward $85.
- Inflation came in hot but expected: May CPI (released Wednesday) printed 4.2% year over year — a multi-year high, in line with consensus — keeping rate worries alive but not escalating them.
- A record-breaking Friday: all three major indexes posted their best single day since April 8. The Dow climbed +1.9% (929.97 points) to 50,848.75, the Nasdaq Composite jumped +2.5% to 25,809.66, and the S&P 500 advanced +1.8% to 7,393.30.
Scorecard: June 8–12 Callouts vs. Actual Weekly Candle
We grade our June 8–12 callouts against that week’s actual high, low, and Friday close using verified weekly OHLC data. This sheet skewed defensive: most names broke their Below levels during the week, while only a small group managed clean Above trigger wins.
| Ticker | Above | Below | Wk High | Wk Low | Wk Close | Result |
|---|---|---|---|---|---|---|
| SPY | $760.00 | $735.00 | $746.90 | $722.59 | $741.75 | 🔴 Below — +2T |
| QQQ | $747.50 | $700.00 | $725.66 | $686.37 | $721.34 | 🔴 Below — +2T |
| IWM | $293.00 | $280.00 | $295.72 | $277.62 | $292.95 | 🔄 Both — A+1T, B+0T |
| GOOGL | $390.00 | $360.00 | $372.08 | $346.36 | $359.68 | 🔴 Below — +2T |
| MU | $1100.00 | $850.00 | $1012.62 | $854.35 | $981.61 | ⚪ No trigger |
| MSFT | $440.00 | $405.00 | $417.16 | $382.27 | $390.74 | 🔴 Below — +4T |
| UNH | $405.00 | $378.00 | $415.98 | $394.99 | $408.52 | 🟢 Above — +3T |
| META | $630.00 | $587.50 | $597.63 | $557.01 | $566.98 | 🔴 Below — +4T |
| AVGO | $440.00 | $380.00 | $407.87 | $370.33 | $382.07 | 🔴 Below — +0T |
| WMT | $122.50 | $113.00 | $121.86 | $117.53 | $121.04 | ⚪ No trigger |
| BAC | $54.50 | $50.00 | $56.19 | $53.57 | $56.02 | 🟢 Above — +1T |
| AAPL | $317.50 | $305.00 | $317.40 | $287.38 | $291.13 | 🔴 Below — +6T |
| NVDA | $227.50 | $202.50 | $211.40 | $199.34 | $205.19 | 🔴 Below — +1T |
The tally: 9 of 13 callouts broke Below during the week, only 3 of 13 hit their Above trigger (IWM, UNH, BAC), and just 1 name — IWM — touched both sides. AAPL was the biggest downside extension with six downside targets cleared.
This Week’s Bullish Setups (Above Trigger)
If price trades above the Above level, these are the upside targets in order (T1 → T7) for the week of June 15–19.
| Ticker | Above | T1 | T2 | T3 | T4 | T5 | T6 | T7 |
|---|---|---|---|---|---|---|---|---|
| SPY | $760.00 | $762.50 | $765.00 | $770.00 | — | — | — | — |
| QQQ | $726.25 | $730.00 | $735.00 | $740.00 | $745.00 | $750.00 | — | — |
| IWM | $296.00 | $300.00 | $302.50 | $305.00 | $307.50 | $310.00 | — | — |
| AVGO | $397.50 | $400.00 | $405.00 | $412.50 | $420.00 | $425.00 | $435.00 | $440.00 |
| NVDA | $208.00 | $210.00 | $211.00 | $212.50 | $215.00 | $220.00 | $222.50 | $225.00 |
| META | $590.00 | $595.00 | $600.00 | $605.00 | $607.00 | $610.00 | $612.00 | $620.00 |
| MSFT | $392.50 | $395.00 | $400.00 | $405.00 | $407.50 | $410.00 | $412.50 | $415.00 |
| TSLA | $410.00 | $415.00 | $420.00 | $425.00 | $430.00 | $440.00 | $445.00 | $450.00 |
| INTC | $127.50 | $130.00 | $132.50 | $135.00 | $137.50 | $140.00 | $145.00 | — |
| AAPL | $305.00 | $307.50 | $310.00 | $312.50 | $315.00 | $317.50 | $320.00 | — |
| PLTR | $132.50 | $135.00 | $137.50 | $140.00 | $142.50 | $145.00 | — | — |
| XOM | $152.50 | $155.00 | $156.25 | $157.50 | $160.00 | $162.50 | $165.00 | — |
| UNH | $416.00 | $417.50 | $420.00 | $425.00 | $430.00 | $435.00 | $440.00 | — |
| SPCX | $177.50 | $180.00 | $185.00 | $190.00 | $195.00 | $200.00 | — | — |
This Week’s Bearish Setups (Below Trigger)
If price trades below the Below level, these are the downside targets in order (T1 → T7).
| Ticker | Below | T1 | T2 | T3 | T4 | T5 | T6 | T7 |
|---|---|---|---|---|---|---|---|---|
| SPY | $735.00 | $732.50 | $730.00 | $720.00 | $715.00 | $711.27 | $705.00 | $702.50 |
| QQQ | $692.50 | $690.00 | $687.75 | $685.00 | $680.00 | $675.00 | $673.00 | $670.00 |
| IWM | $290.00 | $287.50 | $285.00 | $282.50 | $280.00 | $279.50 | $277.00 | — |
| AVGO | $370.00 | $365.00 | $360.00 | $350.00 | $345.00 | $340.00 | $330.00 | — |
| NVDA | $200.00 | $197.50 | $195.00 | $192.50 | $190.00 | $187.50 | $185.00 | — |
| META | $552.50 | $550.00 | $540.00 | $530.00 | $520.00 | — | — | — |
| MSFT | $382.00 | $380.00 | $375.00 | $370.00 | $365.00 | $360.00 | $355.00 | $350.00 |
| TSLA | $380.00 | $375.00 | $370.00 | $360.00 | $355.00 | $350.00 | — | — |
| INTC | $107.50 | $105.00 | $102.50 | $100.00 | $97.50 | $95.00 | $92.50 | $90.00 |
| AAPL | $288.00 | $285.50 | $282.50 | $280.00 | $275.00 | $270.00 | — | — |
| PLTR | $126.50 | $125.00 | $122.50 | $120.00 | $117.50 | $115.00 | $112.50 | $110.00 |
| XOM | $145.00 | $142.50 | $141.00 | $140.00 | $138.25 | $137.50 | — | — |
| UNH | $396.00 | $392.50 | $391.00 | $390.00 | $388.00 | $385.00 | $380.00 | — |
| SPCX | $155.00 | $150.00 | $149.00 | $147.50 | $145.00 | $142.50 | $140.00 | $135.00 |
Stock-by-Stock Deep Dives
Dark pool flow below reflects the week of June 8–12 (minimum 500,000-share prints, opening and closing crosses excluded). Levels shown are this week’s June 15–19 callouts.
SPY — SPDR S&P 500 ETF Trust
Dark pool flow: $15.67B across 21.25M shares and 19 prints. Average reported print price: $737.26.
Weekly range: $746.90 – $722.59 | Friday close: $741.75 (+0.54%)
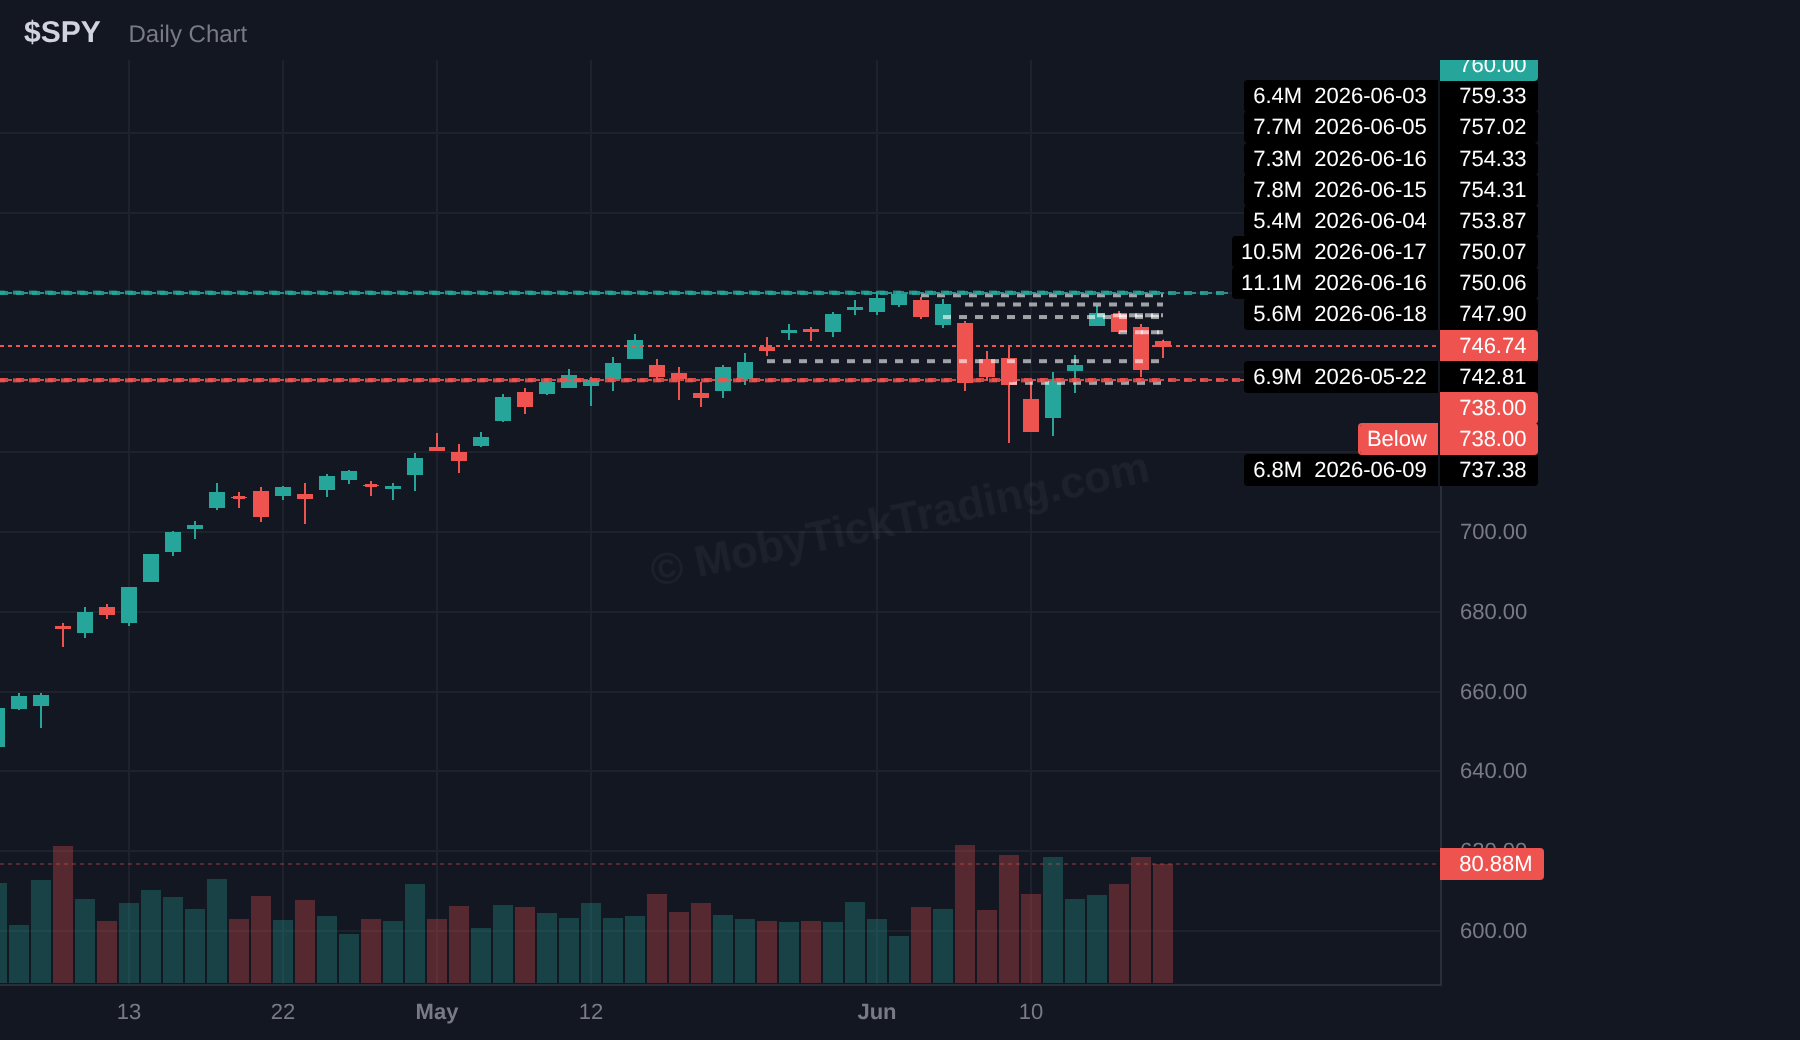
▲ Above $760.00 — Targets: $762.50, $765.00, $770.00
▼ Below $735.00 — Targets: $732.50, $730.00, $720.00, $715.00, $711.27, $705.00, $702.50.
QQQ — Invesco QQQ Trust
Dark pool flow: $2.82B across 3.99M shares and 5 prints. Average reported print price: $707.51.
Weekly range: $725.66 – $686.37 | Friday close: $721.34 (+0.59%)
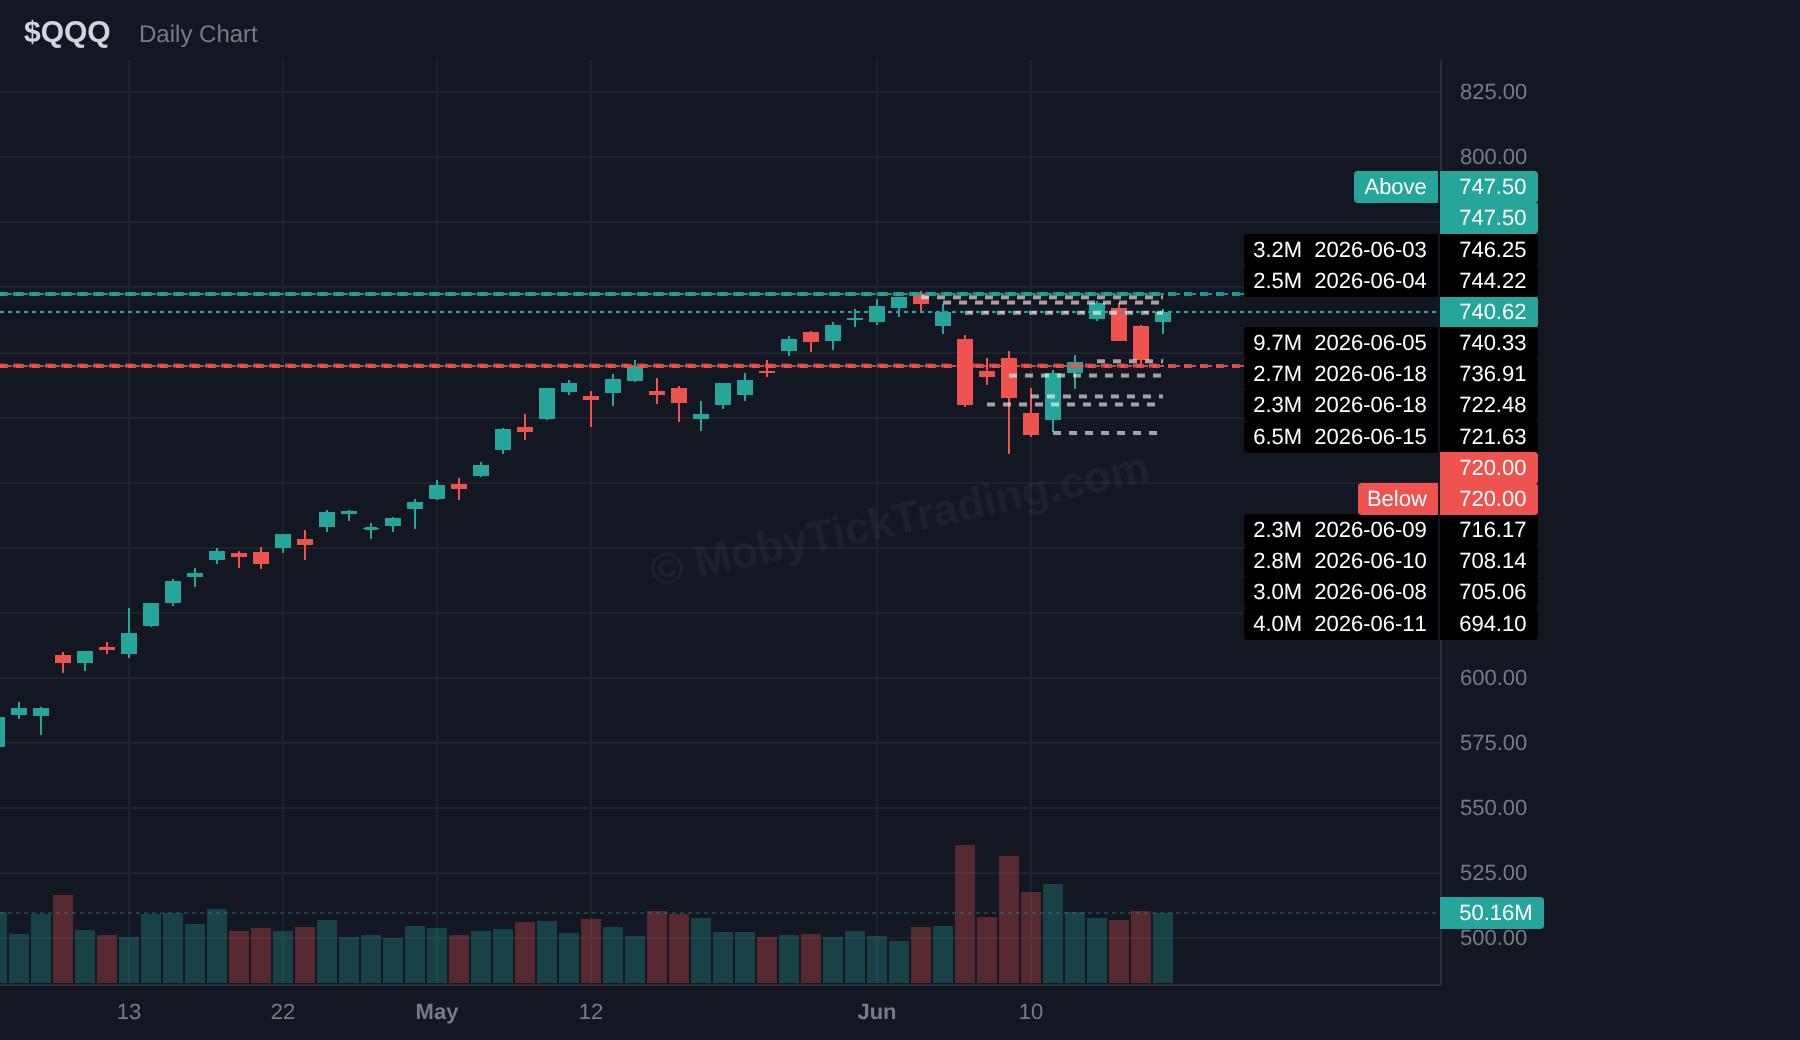
▲ Above $726.25 — Targets: $730.00, $735.00, $740.00, $745.00, $750.00
▼ Below $692.50 — Targets: $690.00, $687.75, $685.00, $680.00, $675.00, $673.00, $670.00.
IWM — iShares Russell 2000 ETF
Dark pool flow: $2.54B across 8.85M shares and 10 prints. Average reported print price: $287.12.
Weekly range: $295.72 – $277.62 | Friday close: $292.95 (+0.87%)
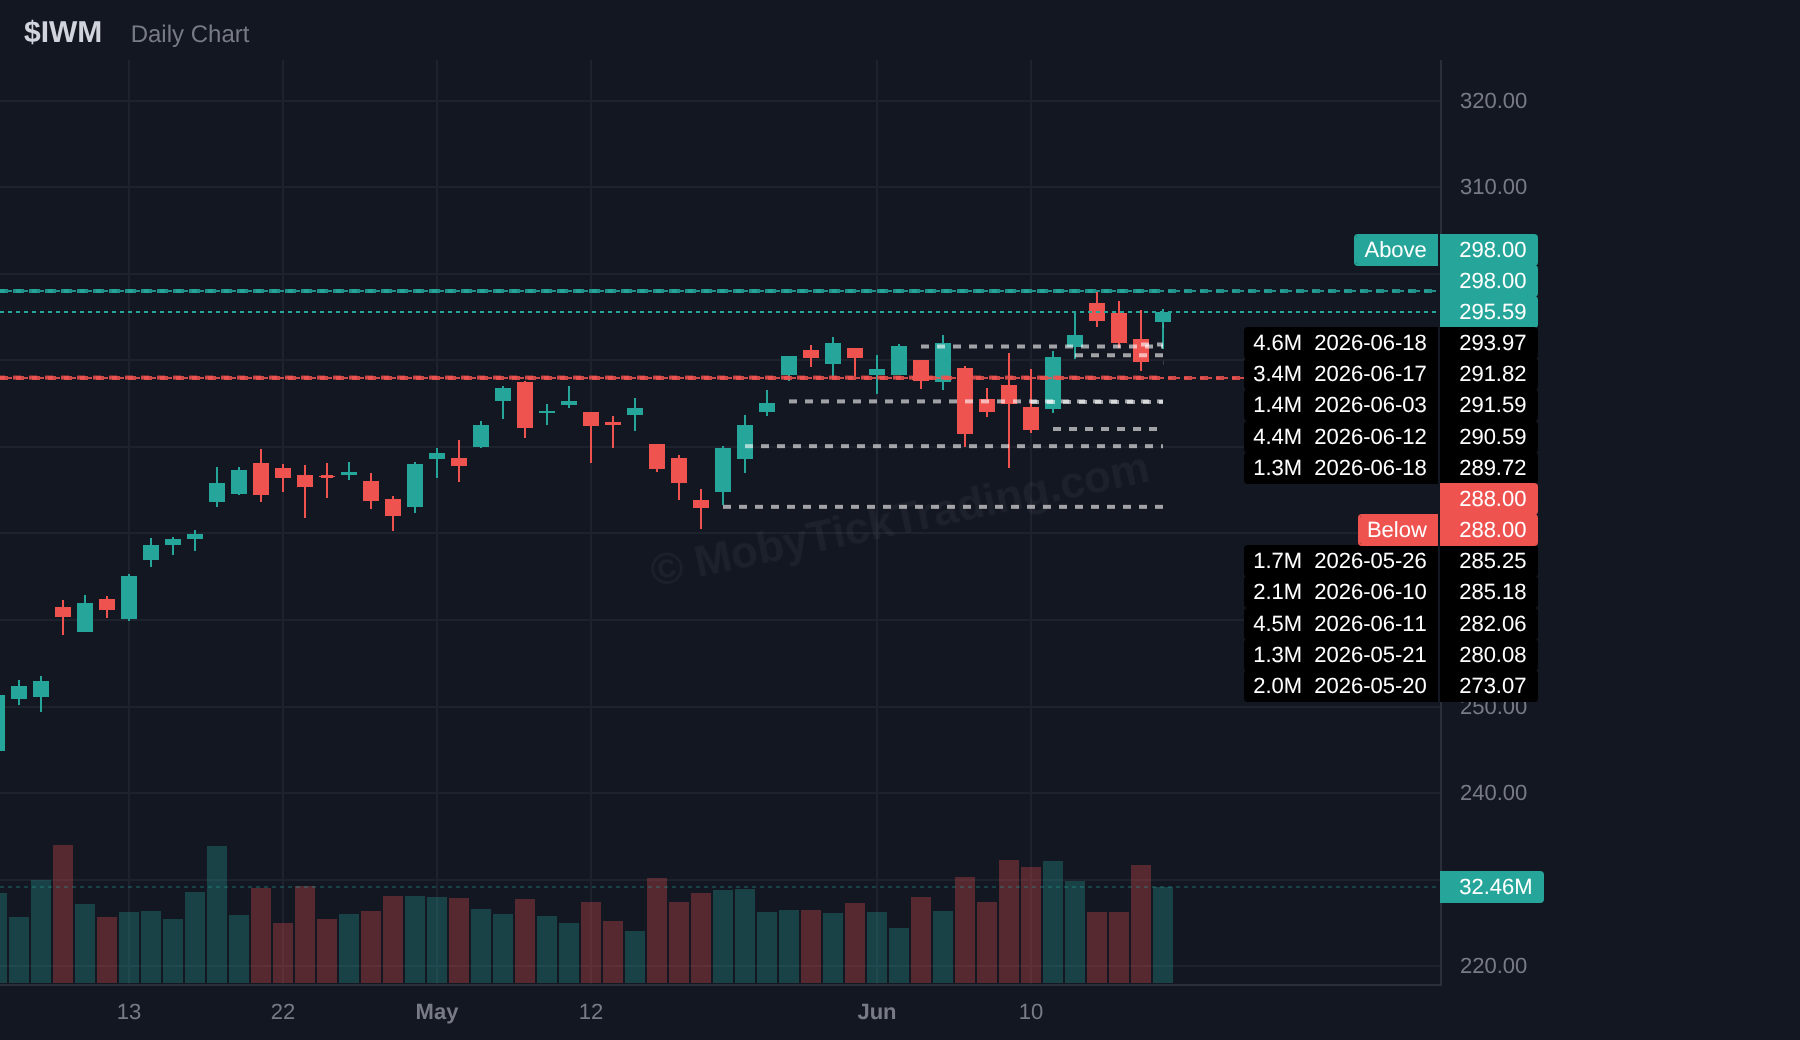
▲ Above $296.00 — Targets: $300.00, $302.50, $305.00, $307.50, $310.00
▼ Below $290.00 — Targets: $287.50, $285.00, $282.50, $280.00, $279.50, $277.00.
AVGO — Broadcom
Dark pool flow: $7.62B across 19.73M shares and 16 prints. Average reported print price: $386.06.
Weekly range: $407.87 – $370.33 | Friday close: $382.07 (-0.91%)
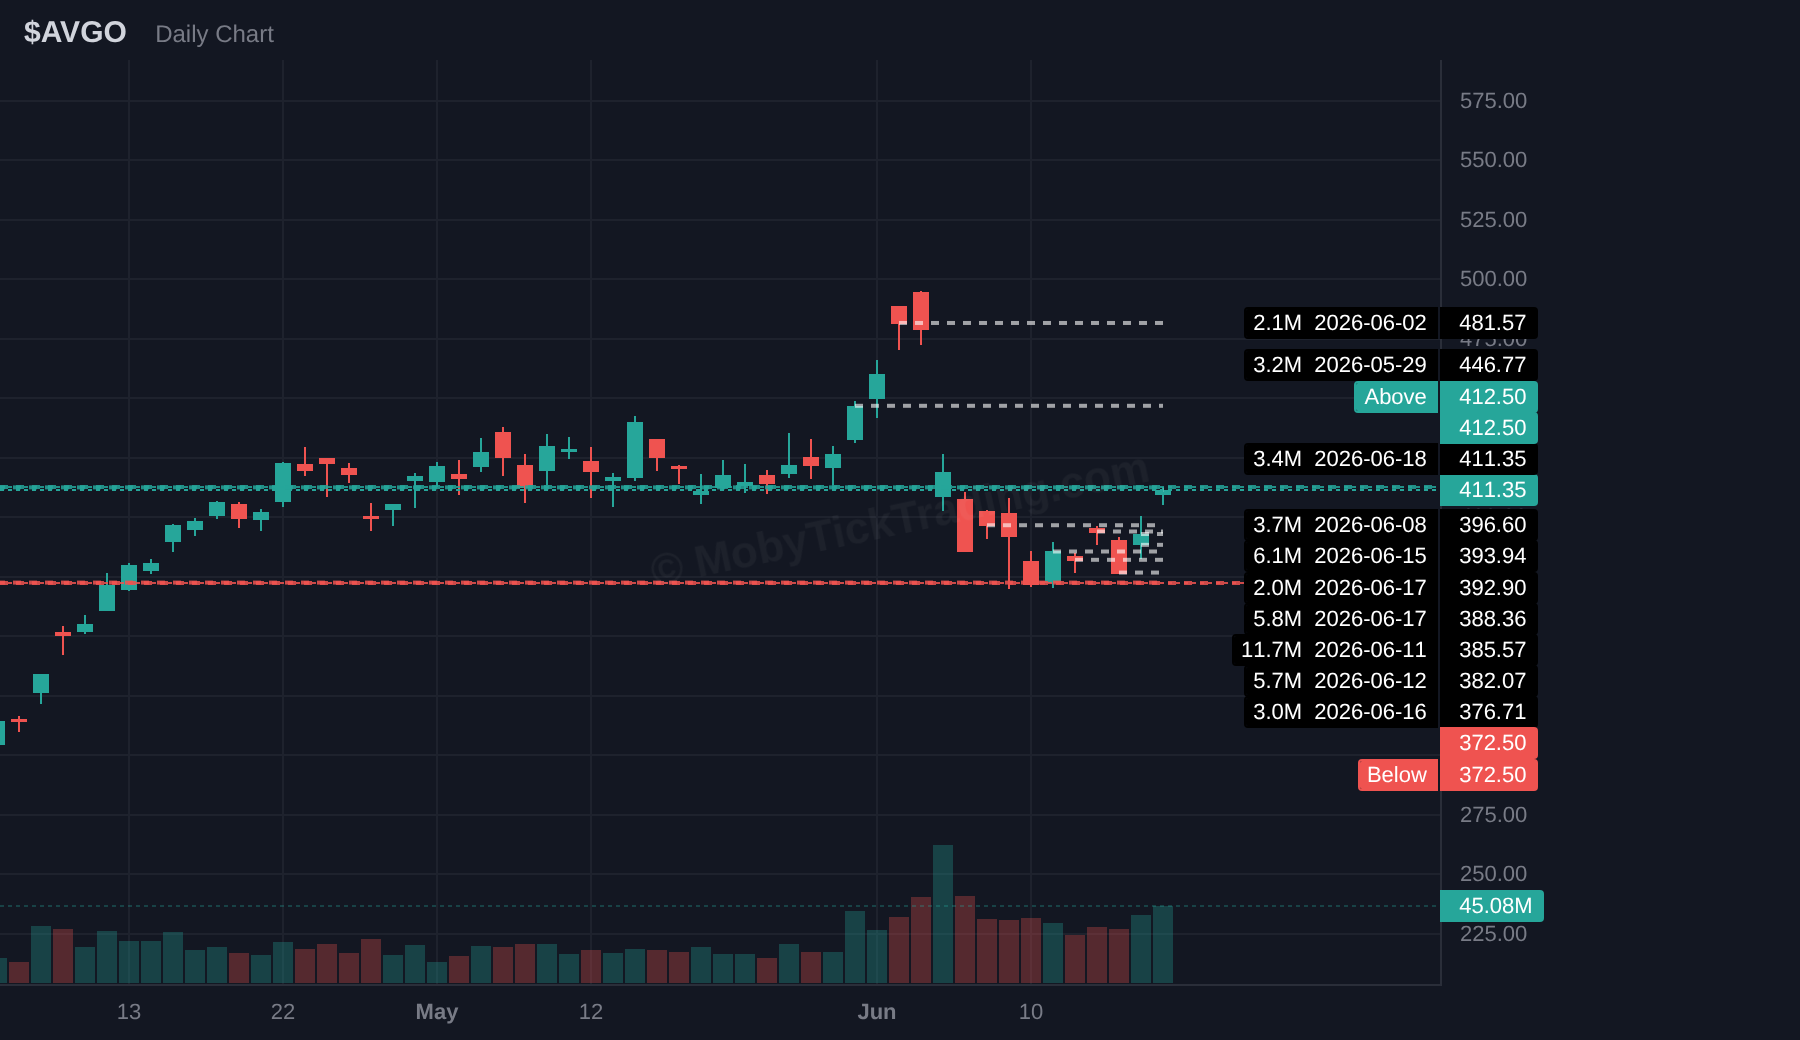
▲ Above $397.50 — Targets: $400.00, $405.00, $412.50, $420.00, $425.00, $435.00, $440.00
▼ Below $370.00 — Targets: $365.00, $360.00, $350.00, $345.00, $340.00, $330.00.
NVDA — NVIDIA
Dark pool flow: $5.67B across 27.63M shares and 25 prints. Average reported print price: $205.39.
Weekly range: $211.40 – $199.34 | Friday close: $205.19 (+0.16%)
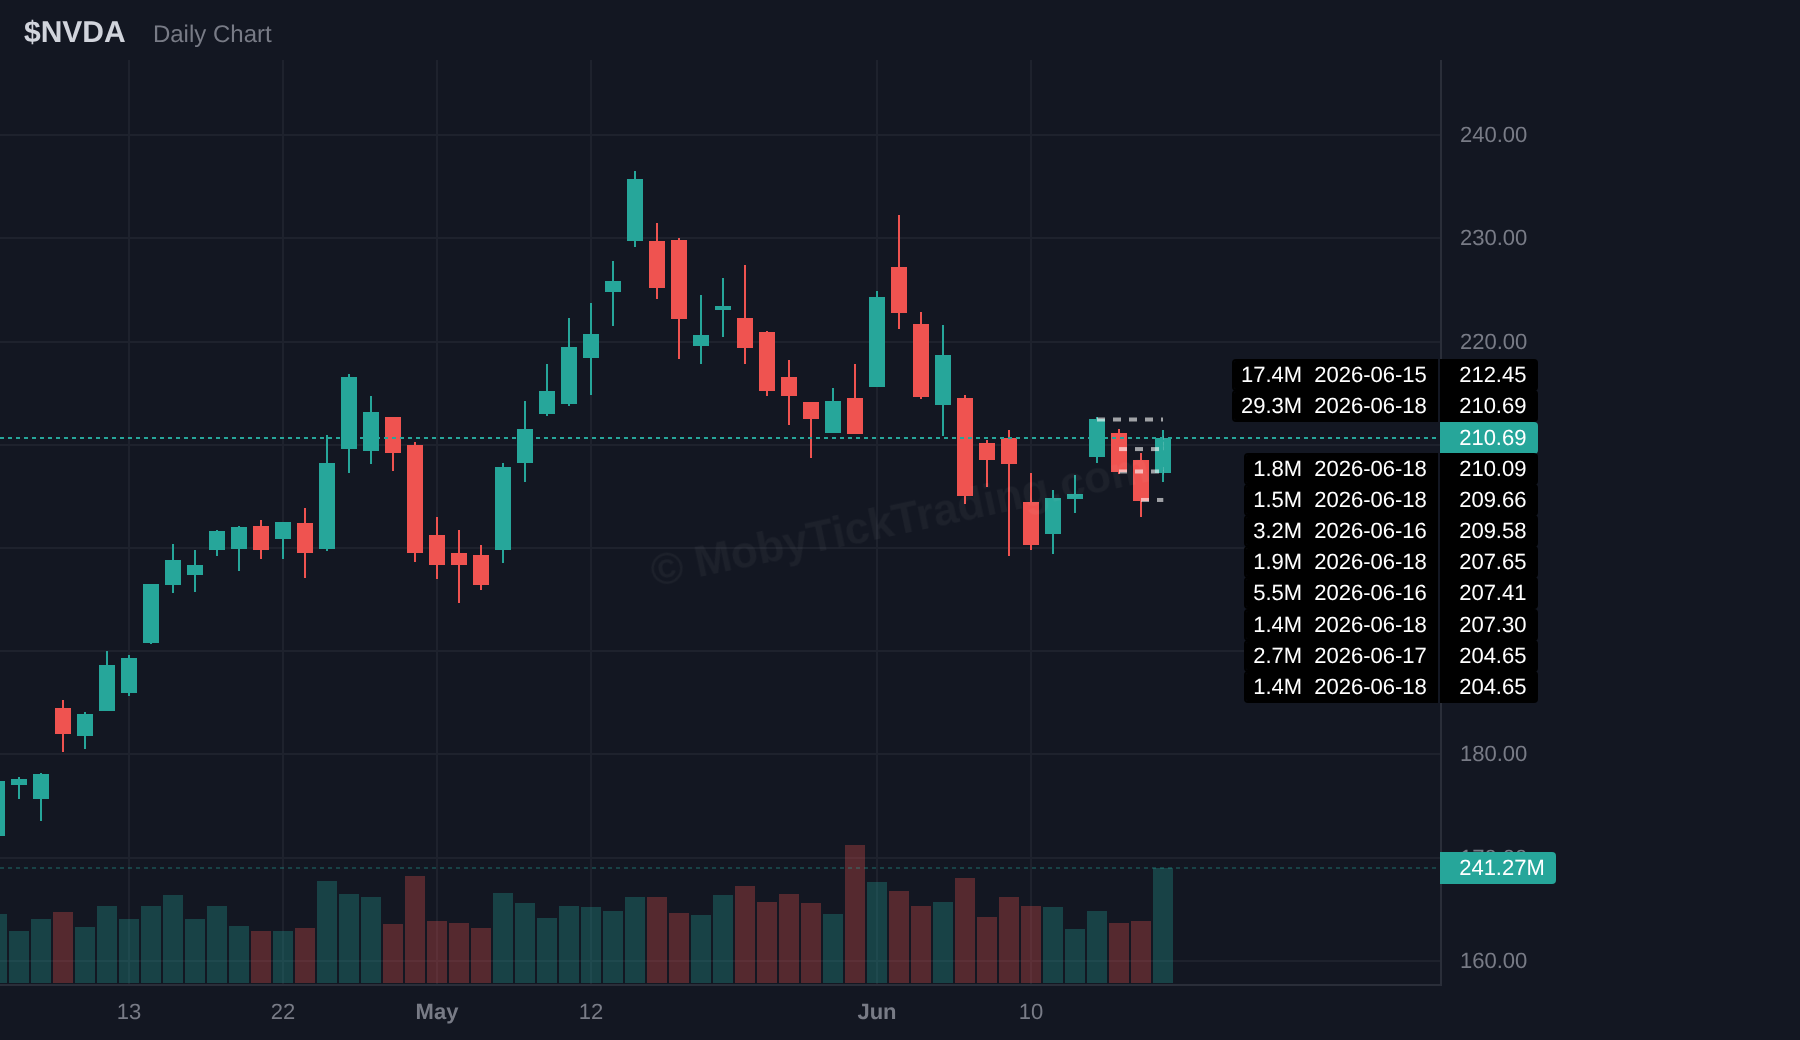
▲ Above $208.00 — Targets: $210.00, $211.00, $212.50, $215.00, $220.00, $222.50, $225.00
▼ Below $200.00 — Targets: $197.50, $195.00, $192.50, $190.00, $187.50, $185.00.
META — Meta Platforms
Dark pool flow: $4.80B across 8.23M shares and 11 prints. Average reported print price: $582.58.
Weekly range: $597.63 – $557.01 | Friday close: $566.98 (-0.26%)
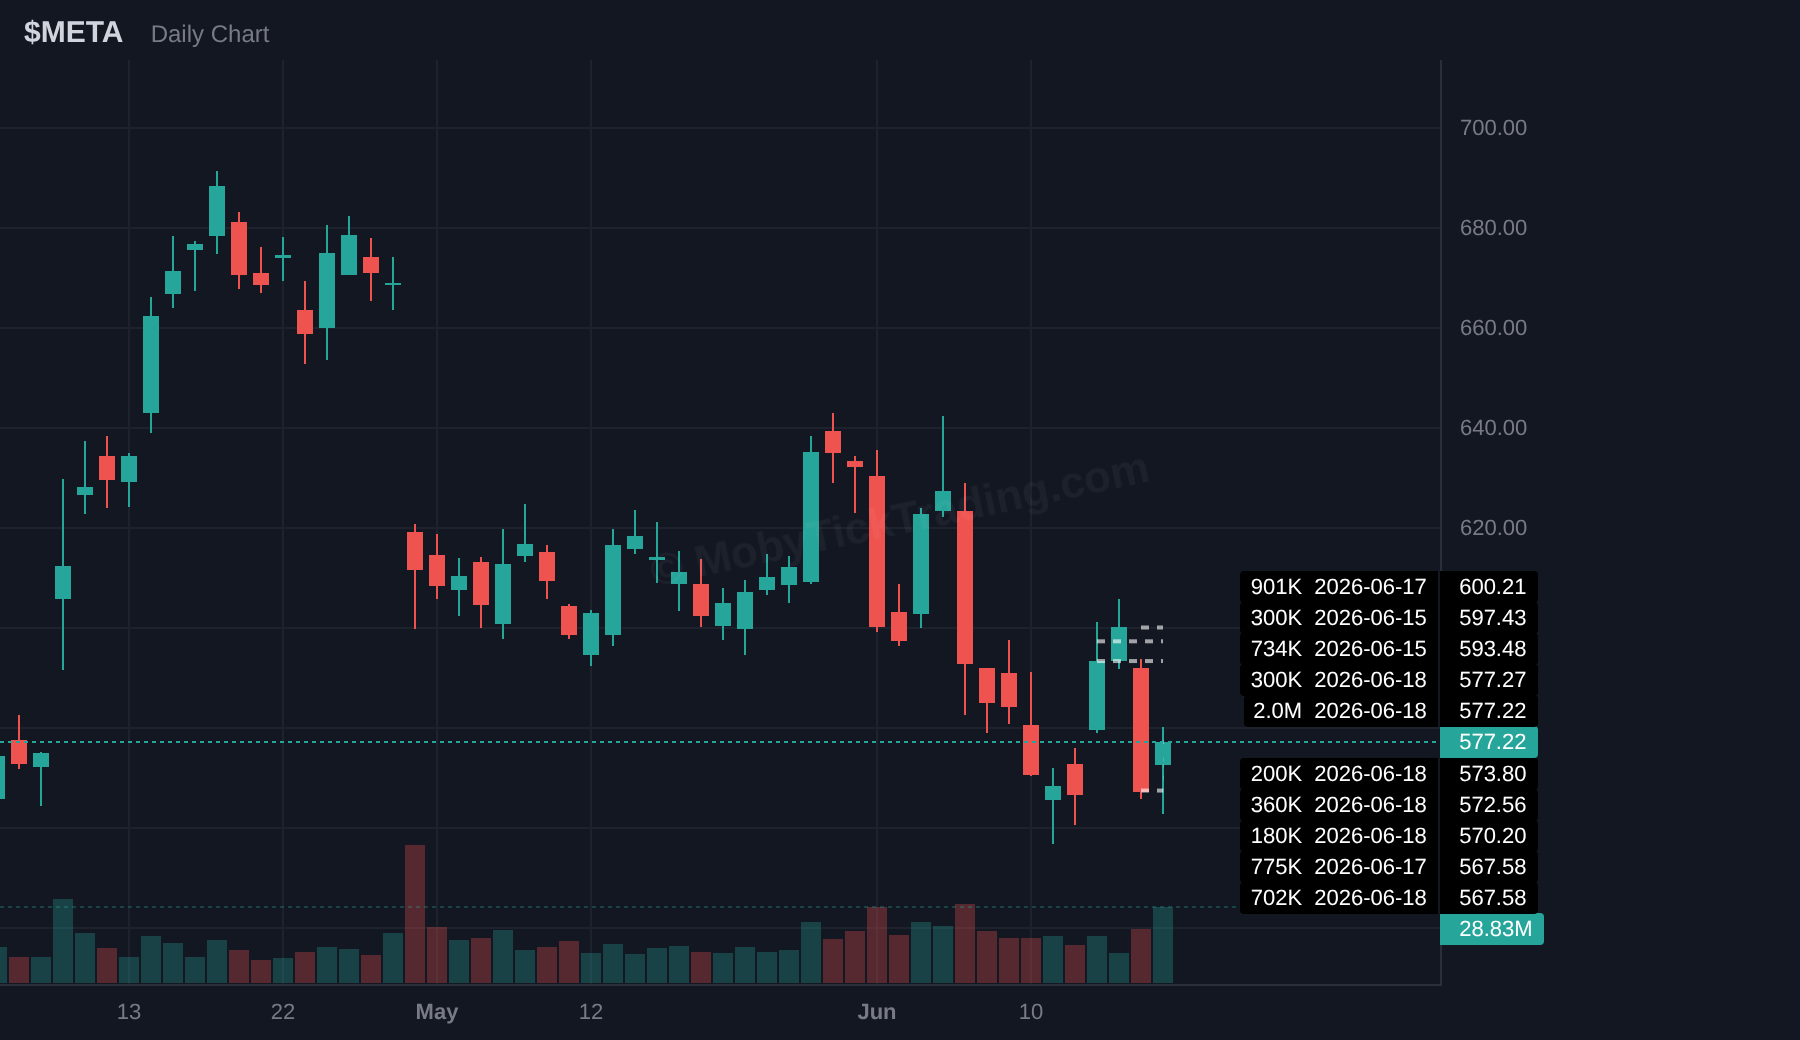
▲ Above $590.00 — Targets: $595.00, $600.00, $605.00, $607.00, $610.00, $612.00, $620.00
▼ Below $552.50 — Targets: $550.00, $540.00, $530.00, $520.00.
MSFT — Microsoft
Dark pool flow: $2.83B across 7.04M shares and 9 prints. Average reported print price: $401.70.
Weekly range: $417.16 – $382.27 | Friday close: $390.74 (+0.10%)
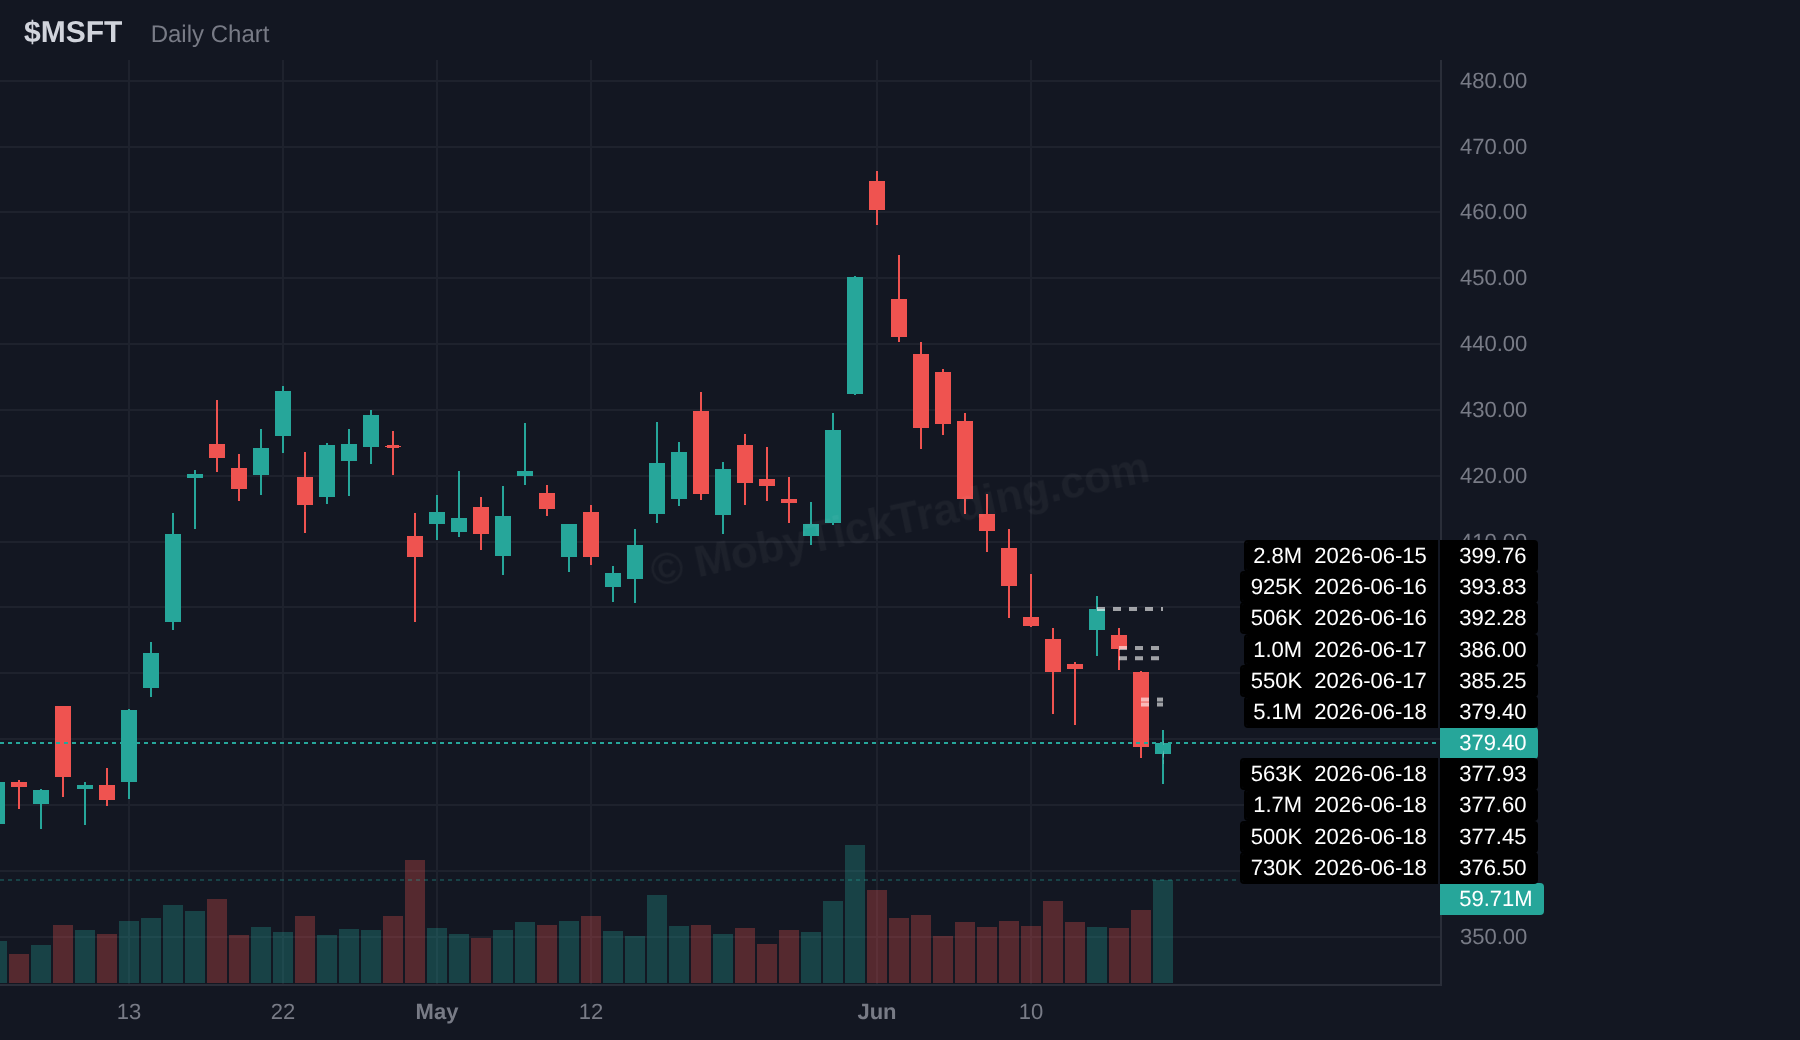
▲ Above $392.50 — Targets: $395.00, $400.00, $405.00, $407.50, $410.00, $412.50, $415.00
▼ Below $382.00 — Targets: $380.00, $375.00, $370.00, $365.00, $360.00, $355.00, $350.00.
TSLA — Tesla
Dark pool flow: $2.48B across 6.22M shares and 10 prints. Average reported print price: $398.80.
Weekly range: $418.50 – $380.15 | Friday close: $406.43 (+1.82%)
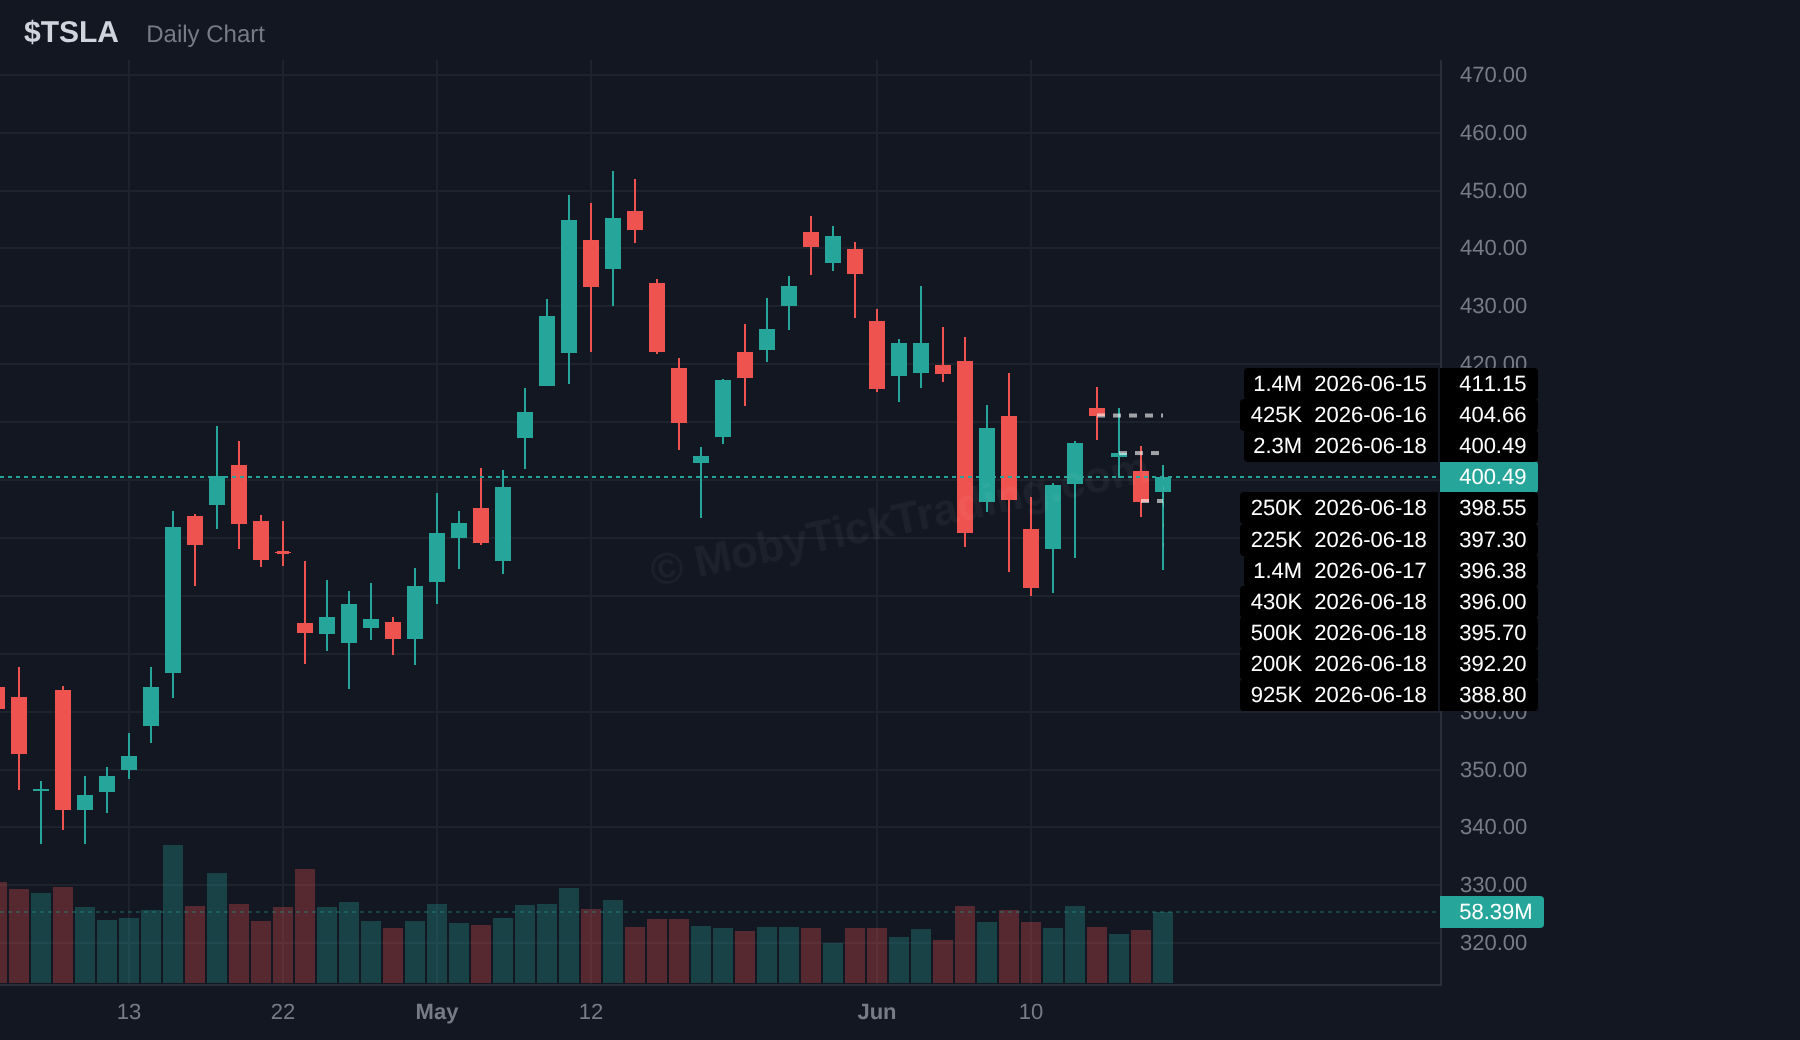
▲ Above $410.00 — Targets: $415.00, $420.00, $425.00, $430.00, $440.00, $445.00, $450.00
▼ Below $380.00 — Targets: $375.00, $370.00, $360.00, $355.00, $350.00.
INTC — Intel
Dark pool flow: $2.03B across 17.08M shares and 13 prints. Average reported print price: $118.82.
Weekly range: $127.60 – $99.46 | Friday close: $124.57 (+6.51%)
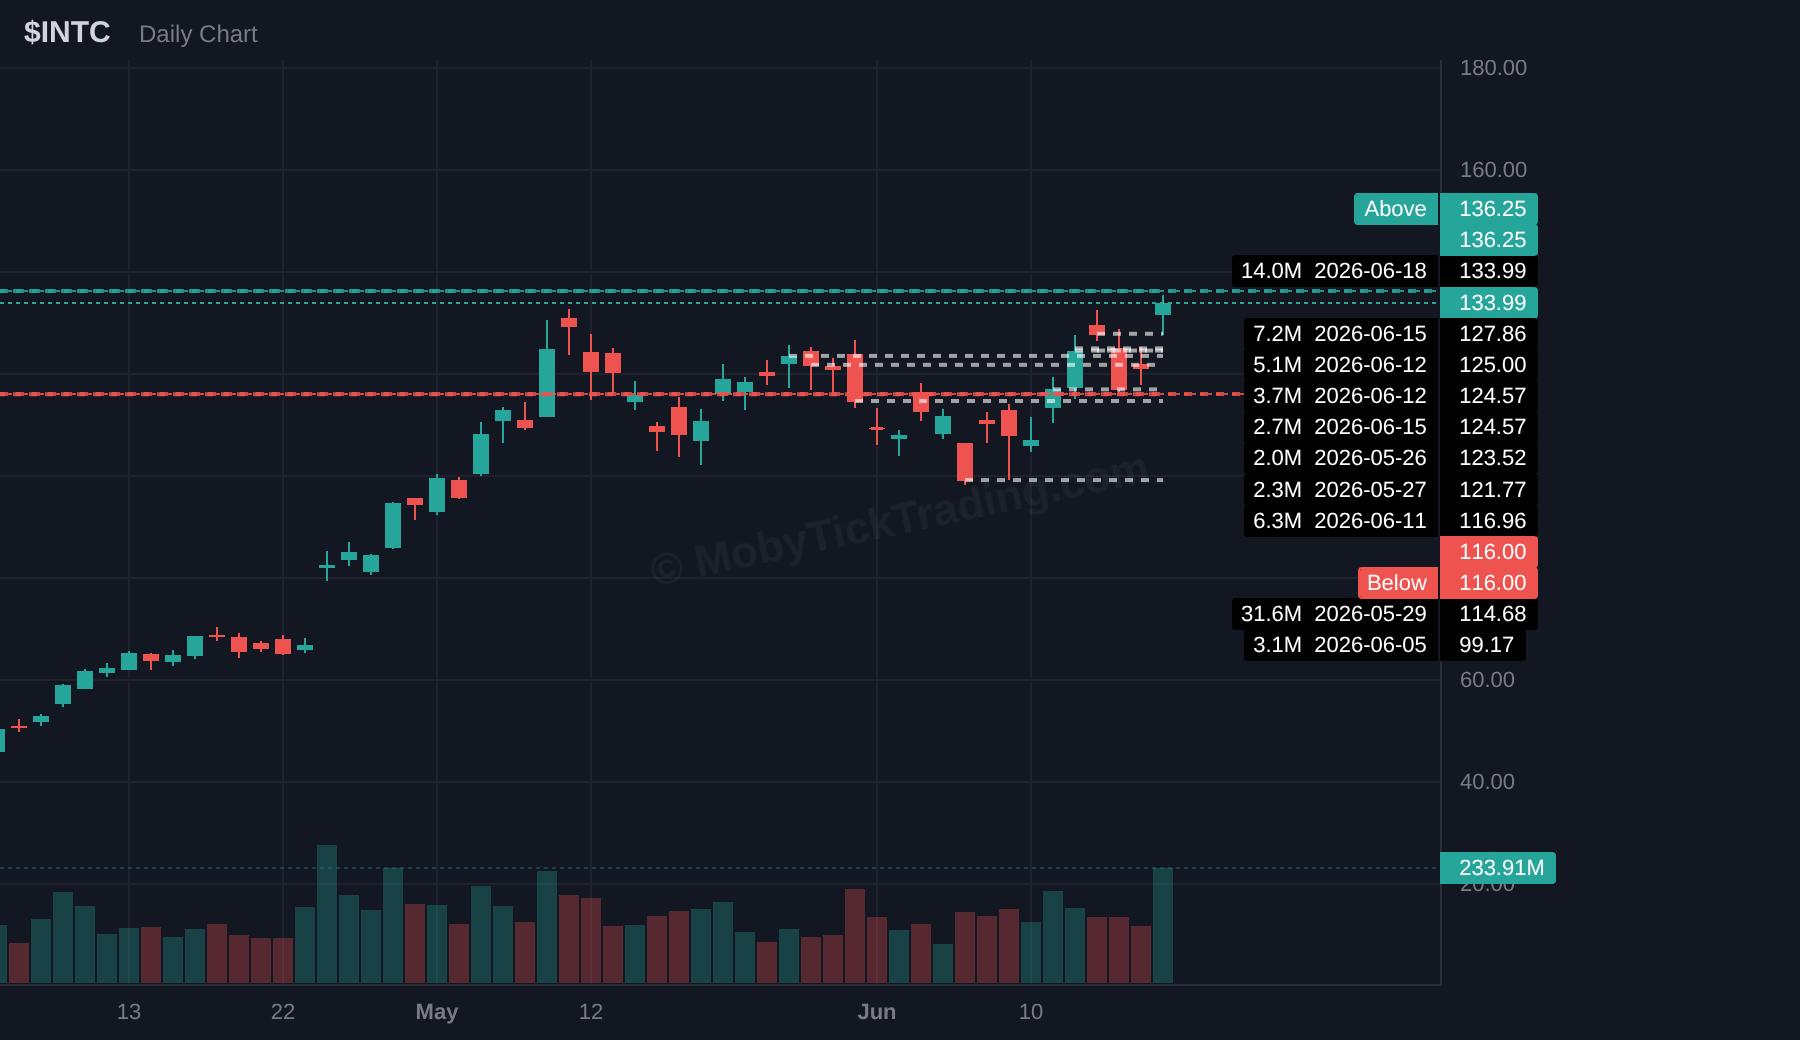
▲ Above $127.50 — Targets: $130.00, $132.50, $135.00, $137.50, $140.00, $145.00
▼ Below $107.50 — Targets: $105.00, $102.50, $100.00, $97.50, $95.00, $92.50, $90.00.
AAPL — Apple
Dark pool flow: $1.63B across 5.54M shares and 6 prints. Average reported print price: $294.00.
Weekly range: $317.40 – $287.38 | Friday close: $291.13 (-1.52%)
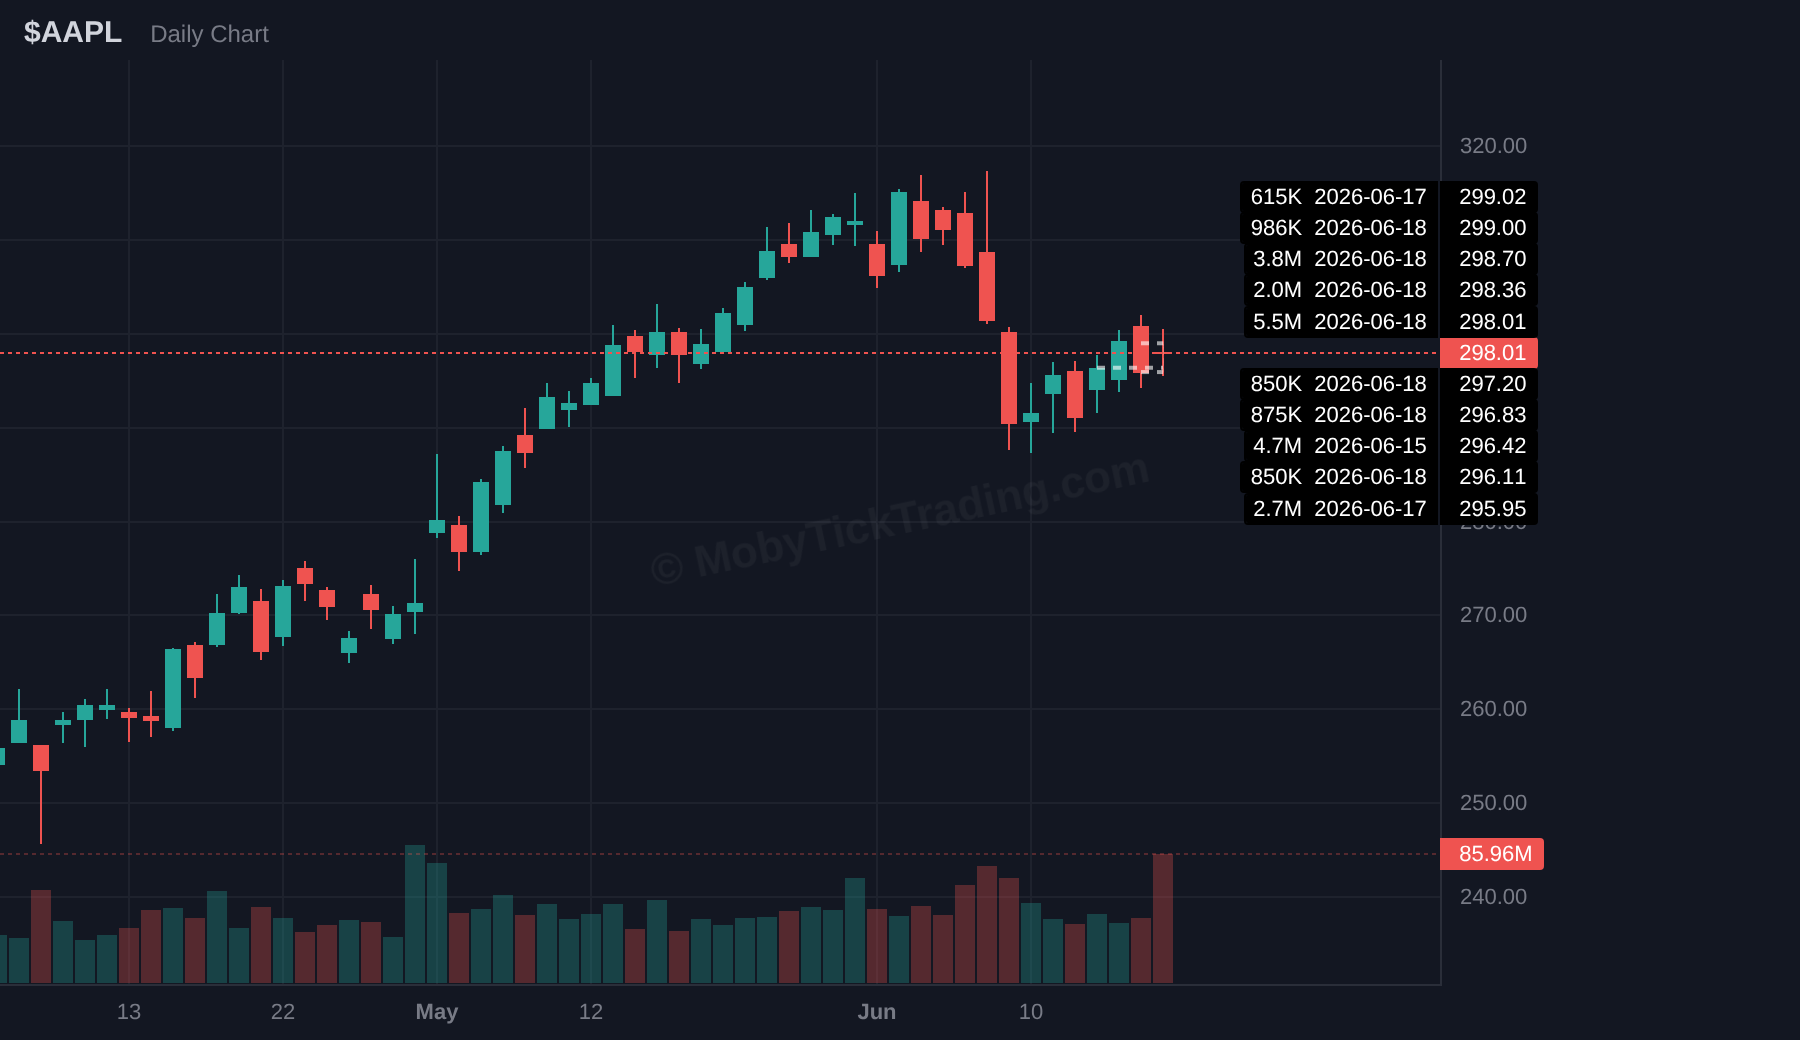
▲ Above $305.00 — Targets: $307.50, $310.00, $312.50, $315.00, $317.50, $320.00
▼ Below $288.00 — Targets: $285.50, $282.50, $280.00, $275.00, $270.00.
PLTR — Palantir Technologies
Dark pool flow: $1.46B across 11.19M shares and 10 prints. Average reported print price: $130.78.
Weekly range: $137.76 – $126.65 | Friday close: $127.99 (-2.36%)
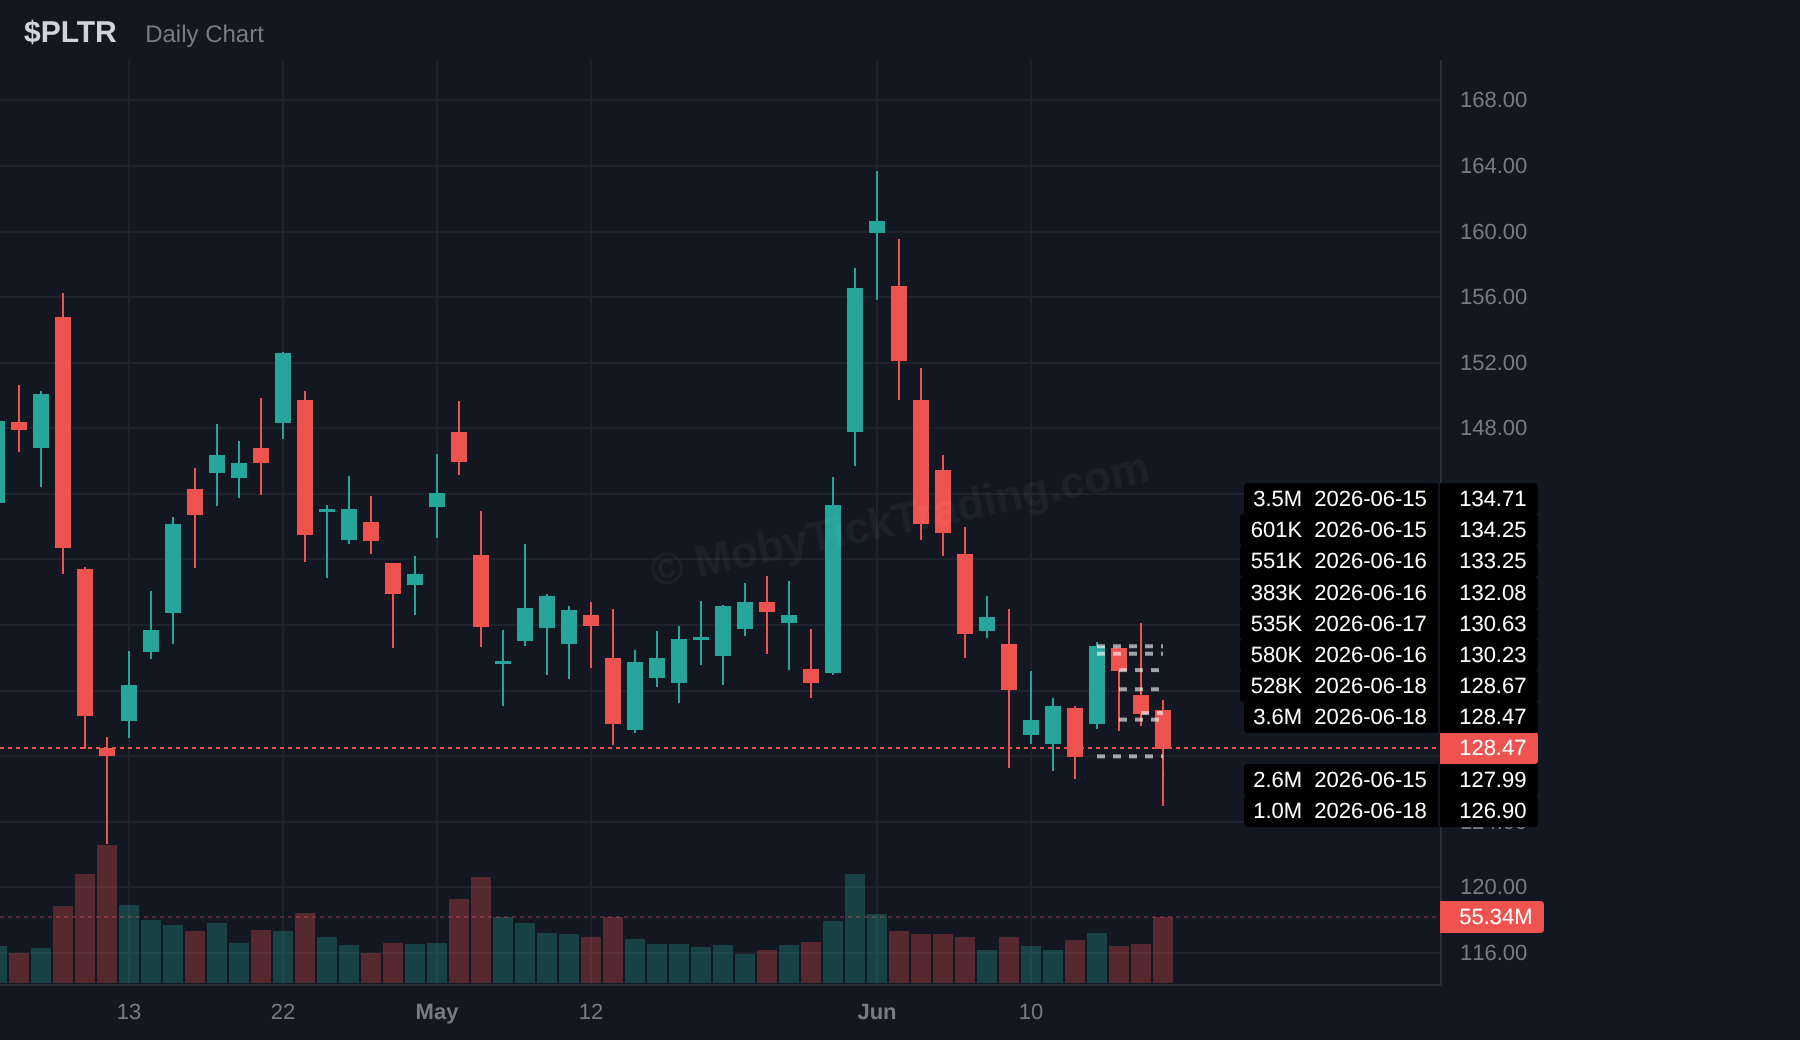
▲ Above $132.50 — Targets: $135.00, $137.50, $140.00, $142.50, $145.00
▼ Below $126.50 — Targets: $125.00, $122.50, $120.00, $117.50, $115.00, $112.50, $110.00.
XOM — ExxonMobil
Dark pool flow: $1.14B across 7.64M shares and 11 prints. Average reported print price: $149.12.
Weekly range: $153.81 – $145.15 | Friday close: $147.01 (+0.28%)
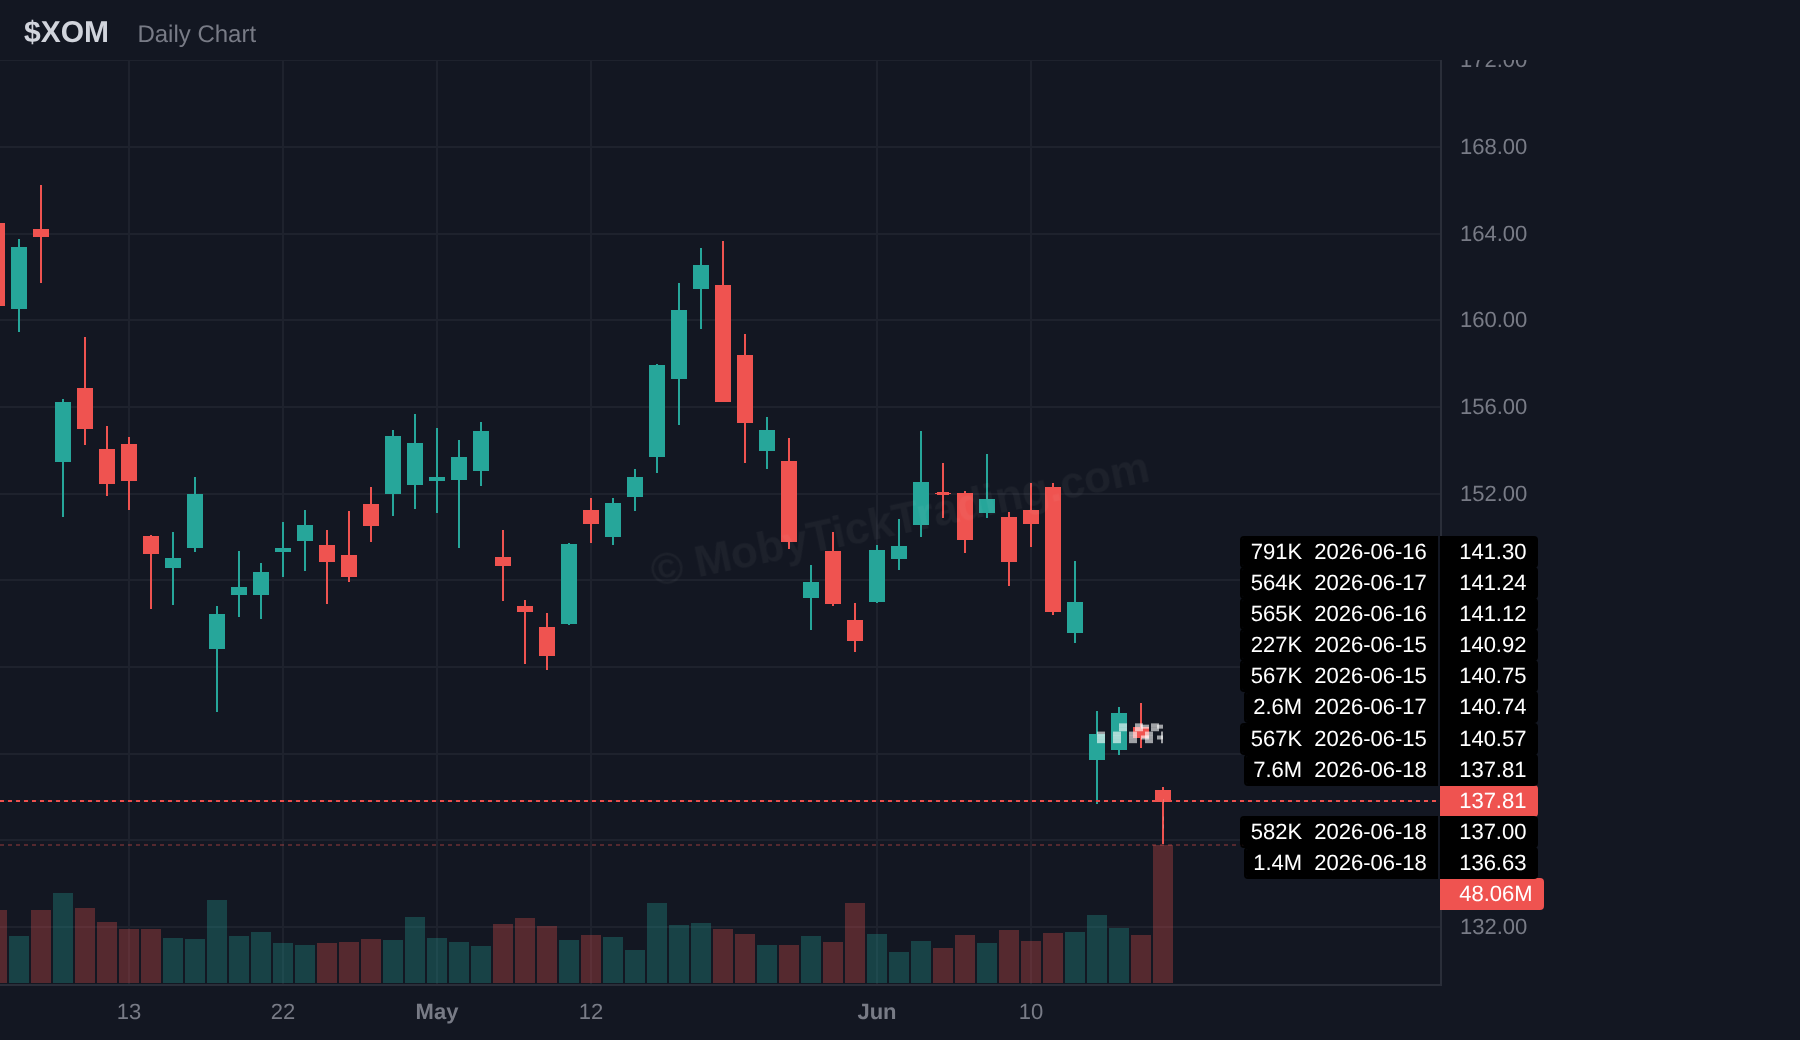
▲ Above $152.50 — Targets: $155.00, $156.25, $157.50, $160.00, $162.50, $165.00
▼ Below $145.00 — Targets: $142.50, $141.00, $140.00, $138.25, $137.50.
UNH — UnitedHealth Group
Dark pool flow: $918M across 2.24M shares and 3 prints. Average reported print price: $408.86.
Weekly range: $415.98 – $394.99 | Friday close: $408.52 (+0.73%)
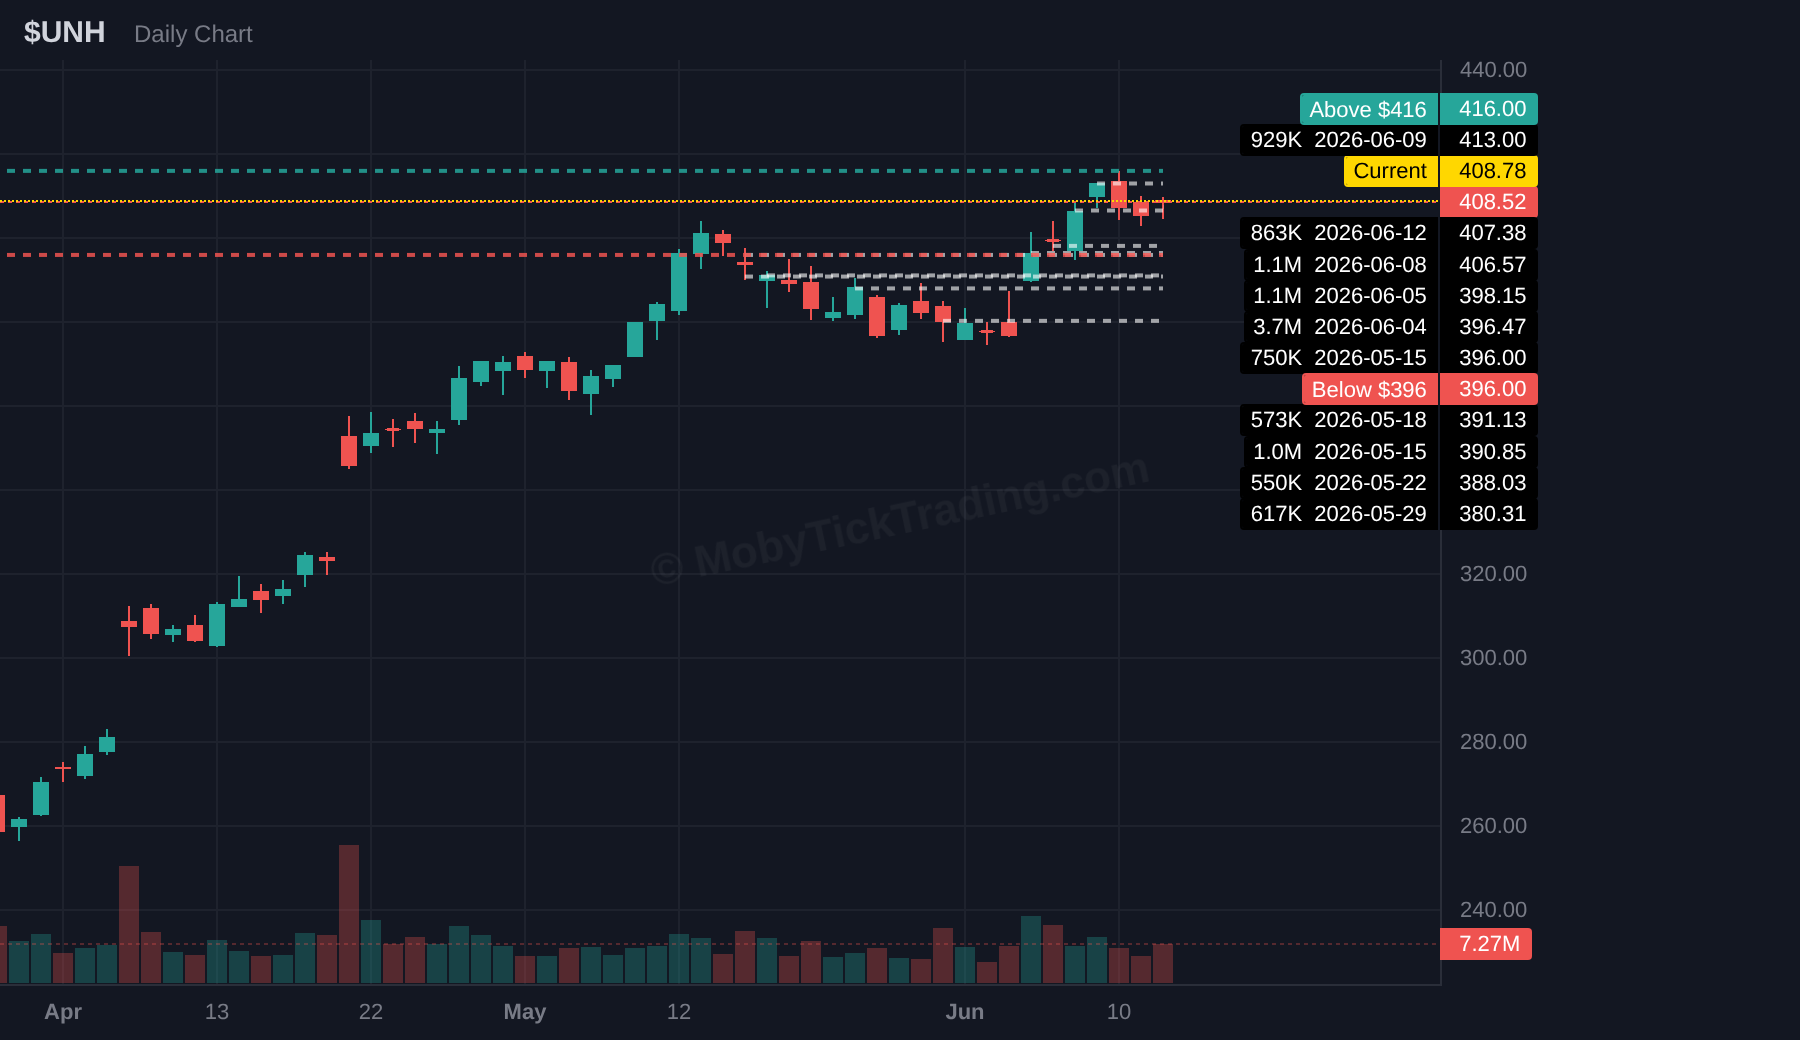
▲ Above $416.00 — Targets: $417.50, $420.00, $425.00, $430.00, $435.00, $440.00
▼ Below $396.00 — Targets: $392.50, $391.00, $390.00, $388.00, $385.00, $380.00.
SPCX — SpaceX
Dark pool flow: $1.36B across 8.37M shares and 3 prints. Average reported print price: $162.96.
Weekly range: $176.52 – $149.34 | First-session close: $160.95 (+19.22%) | Status: New listing (IPO June 12). SpaceX has no prior weekly candle, so it does not appear in the scorecard; levels are forward-looking only.
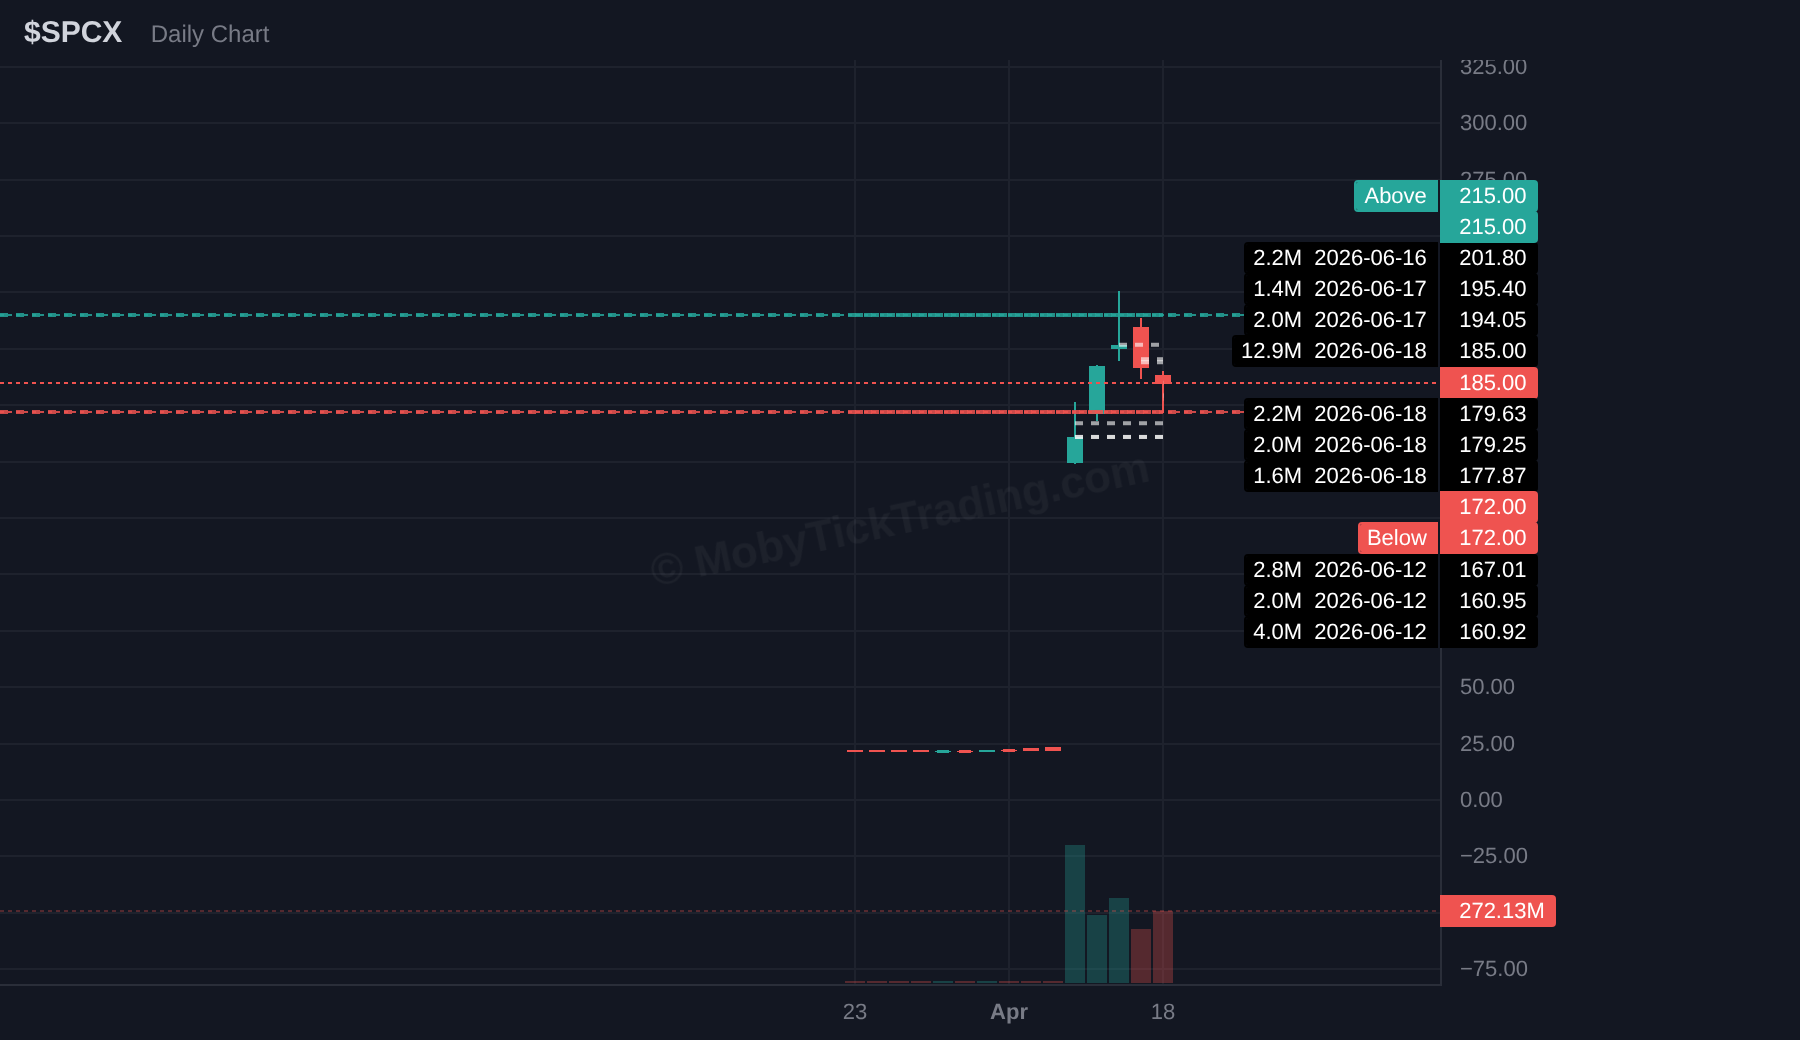
▲ Above $177.50 — Targets: $180.00, $185.00, $190.00, $195.00, $200.00
▼ Below $155.00 — Targets: $150.00, $149.00, $147.50, $145.00, $142.50, $140.00, $135.00.
SpaceX IPO Deep Dive: The Numbers Behind History
On Friday June 12, 2026, SpaceX became a public company under the Nasdaq ticker SPCX and rewrote the record books. The offering priced at $135.00 per share for roughly 555.6 million shares, raising approximately $75 billion — more than every other U.S. IPO of the prior two years combined, per Renaissance Capital, and the largest public offering in history.
At the $135 pricing, SpaceX carried a valuation near $1.77 trillion. It opened for trading just before noon at $150, already 11% above the IPO price, and climbed to close its first session at $160.95, a 19% gain, on volume of roughly 519 million shares with an intraday range of $149.34 to $176.52. By the close, the implied market capitalization pushed above $2 trillion, with after-hours trading lifting it toward $2.2 trillion. The milestone made Elon Musk the world’s first trillionaire, his combined net worth crossing roughly $1.1 trillion as the stock began trading.
From a dark pool perspective, the debut was equally historic. With opening and closing crosses excluded and our 500,000-share minimum applied, SPCX recorded over $1.4 billion in qualifying off-exchange block volume in its very first session — extraordinary for a stock with zero trading history that morning.
Why We Exclude Closing Prints
Closing prints are large batches of trades matched right at the market close. They are real trades, but they often serve a different purpose than regular trading during the session. Funds, ETFs, and large money managers use them to get execution at the official closing price — for portfolio rebalancing, index tracking, or simply getting large size done at once.
That matters because a closing print does not always mean someone was actively choosing that price as an important level. For level analysis, closing prints can make one price look more important than it really was, pull the weekly average toward the close, and tell us less about where size showed up during regular-session price discovery. That is why we exclude them — we want the cleaner picture of where meaningful size traded during the week.
Start Your 7-Day Free Trial
MobyTick gives retail traders institutional-grade dark pool and block trade intelligence across 10,000+ stocks. Start your free trial →
This report is for educational and informational purposes only. It is not financial advice or a recommendation to buy or sell any security. Past performance does not guarantee future results. Trading involves risk.