Physical Address
304 North Cardinal St.
Dorchester Center, MA 02124
Physical Address
304 North Cardinal St.
Dorchester Center, MA 02124

Dark pool block trade analysis for the week of June 29–July 2, 2026, with callout levels for July 6–10. Sector rotation from semiconductors to financials.
The week of June 29 through July 2 delivered one of the clearest leadership rotations of the year. On the surface, the tape looked calm and even celebratory: the Dow Jones Industrial Average closed at a record high, rising roughly 600 points on Thursday and finishing the week up about 2%. The S&P 500 also gained around 2% on the week, buoyed by broad participation outside of technology. Beneath those headline numbers, however, the market’s internal engine was being rebuilt in real time as capital fled crowded growth names and poured into value, financials, and cyclicals.
The Nasdaq Composite was the clear laggard, slipping 0.8% on Thursday as investors dumped semiconductor names to lock in profits after the group’s enormous first-half run. Semiconductors were the epicenter of the move. The VanEck Semiconductor ETF fell roughly 7% over the week, with a single session accounting for about a 4.5% decline, and the broader chip complex shed an estimated $1.3 to $1.4 trillion in market value across the two-day rout. Micron was the marquee casualty, dropping roughly 13% in a single session and erasing about $138 billion in market capitalization. Nvidia led the sector lower as AI-valuation anxiety collided with heavy profit-taking.
The catalyst that accelerated the shift arrived Thursday with the June nonfarm payrolls report. Employers added just 57,000 jobs, roughly half of consensus expectations that had clustered above 100,000, while the unemployment rate ticked down to 4.2%. The soft print landed hard because it followed a hot May reading near 172,000, making June’s deceleration a genuine surprise. The report reframed the entire rate conversation. Heading into the week, futures markets had been pricing meaningful odds of a Federal Reserve rate hike, with CME FedWatch showing better than a coin-flip chance of a September increase. The payrolls miss knocked that hiking bias off the table and pulled forward easing expectations, flipping the rates narrative decisively dovish. The US Dollar Index slid in step with the repricing.
That dovish shift rewarded the parts of the market most sensitive to rates. Financials led the rotation and helped power the Dow’s record close, while healthcare and consumer staples attracted classic defensive flows. Small caps also benefited, with the Russell 2000 acting as a rotation winner as the softer jobs data eased pressure on rate-sensitive names. The through-line was consistent: richly-valued growth de-rated while value and cyclicals absorbed the capital.
What stands out is how contained sentiment stayed through the turbulence. The VIX held near 16 even as single-name semiconductor volatility spiked, with the term structure in contango and skew elevated near 150. That combination confirms the character of the week: a rotation rather than a panic. Index-level hedging demand remained modest while institutions paid up for tail protection, a signature of quiet repositioning rather than broad de-risking.
The rotation also ran headlong into thinner pre-holiday liquidity ahead of the July 4 close, which tends to amplify directional moves under the surface. The result was a market that made record headlines on the Dow while executing a leadership handoff underneath. MobyTick’s dark pool flow captured where institutions were positioning as this shift unfolded, offering a window into the block activity that tends to precede the visible move on the tape.
| Ticker | Trigger | Hit? | Wk High | Wk Low | Targets Hit | Targets Missed |
|---|---|---|---|---|---|---|
| SPY | $735.00 | ✅ Above | $751.31 | $732.09 | $737.50, $740.00, $742.50, $745.00, $750.00 | $755.00, $760.00 |
| $725.00 | ❌ Below | — | — | |||
| QQQ | $714.00 | ✅ Above | $737.62 | $705.17 | $716.00, $717.50, $720.00, $725.00, $730.00, $735.00 | — |
| $705.00 | ❌ Below | — | — | |||
| IWM | $301.50 | ✅ Above | $302.72 | $294.68 | — | $303.00, $305.00, $308.00, $310.00, $312.50, $315.00 |
| $295.00 | ✅ Below | — | $292.00, $290.00, $287.50, $285.00, $252.50, $280.00 | |||
| NFLX | $76.00 | ✅ Above | $78.44 | $71.00 | $77.50 | $80.00, $82.50, $85.00, $87.50, $90.00 |
| $70.00 | ❌ Below | — | — | |||
| BE | $307.50 | ✅ Above | $320.00 | $257.51 | $315.00 | $325.00, $340.00, $350.00, $360.00 |
| $257.50 | ❌ Below | — | — | |||
| SOFI | $18.50 | ✅ Above | $19.19 | $17.50 | $19.00 | $19.50, $20.00, $21.00, $22.00 |
| $16.87 | ❌ Below | — | — | |||
| CNP | $45.20 | ✅ Above | $45.22 | $43.72 | — | $46.00, $47.50, $48.25, $50.00 |
| $42.50 | ❌ Below | — | — | |||
| UBER | $76.25 | ✅ Above | $77.76 | $71.66 | $77.50 | $78.25, $80.00, $81.25, $82.50 |
| $69.50 | ❌ Below | — | — | |||
| MSFT | $377.50 | ✅ Above | $392.20 | $359.90 | $385.00, $387.50 | $395.00, $405.00, $412.50, $420.00 |
| $360.00 | ✅ Below | — | $355.00, $350.00, $345.00, $340.00, $330.00, $320.00 | |||
| PANW | $306.25 | ✅ Above | $358.10 | $305.33 | $310.00, $312.50, $315.00, $320.00, $325.00, $330.00, $340.00 | — |
| $285.00 | ❌ Below | — | — | |||
| SPCX | $168.50 | ✅ Above | $172.40 | $151.74 | — | $175.00, $180.00, $185.00, $190.00, $200.00, $212.50 |
| $147.50 | ❌ Below | — | — | |||
| SMH | $640.00 | ✅ Above | $659.74 | $582.60 | $650.00 | $660.00, $670.00, $680.00, $690.00, $700.00 |
| $605.00 | ✅ Below | $595.00, $585.00 | $575.00, $560.00, $550.00 | |||
| KO | $83.00 | ✅ Above | $84.14 | $80.96 | $84.00 | $85.00, $86.25, $87.50, $88.25, $90.00 |
| $79.50 | ❌ Below | — | — |
13 of 13 above triggers were crossed this week. PANW led with 7/7 above targets reached after crossing $306.25. IWM, CNP, SPCX crossed their above triggers but did not reach any above targets. 3 of 13 below triggers were crossed. SMH reached 2/5 below targets after crossing $605.00. IWM, MSFT crossed their below triggers but did not reach any below targets. IWM, MSFT, SMH crossed both above and below triggers during the week.
| Ticker | Above Trigger | Upside Targets |
|---|---|---|
| SPY | $757.50 | $760.00, $765.00, $760.00, $765.00, $770.00 |
| QQQ | $741.25 | $745.00, $750.00, $760.00, $770.00, $775.00, $780.00 |
| IWM | $302.50 | $305.00, $307.50, $310.00, $312.50, $315.00, $320.00 |
| MU | $1,100.00 | $1,145.00, $1,200.00, $1,225.00, $1,250.00, $1,275.00, $1,300.00 |
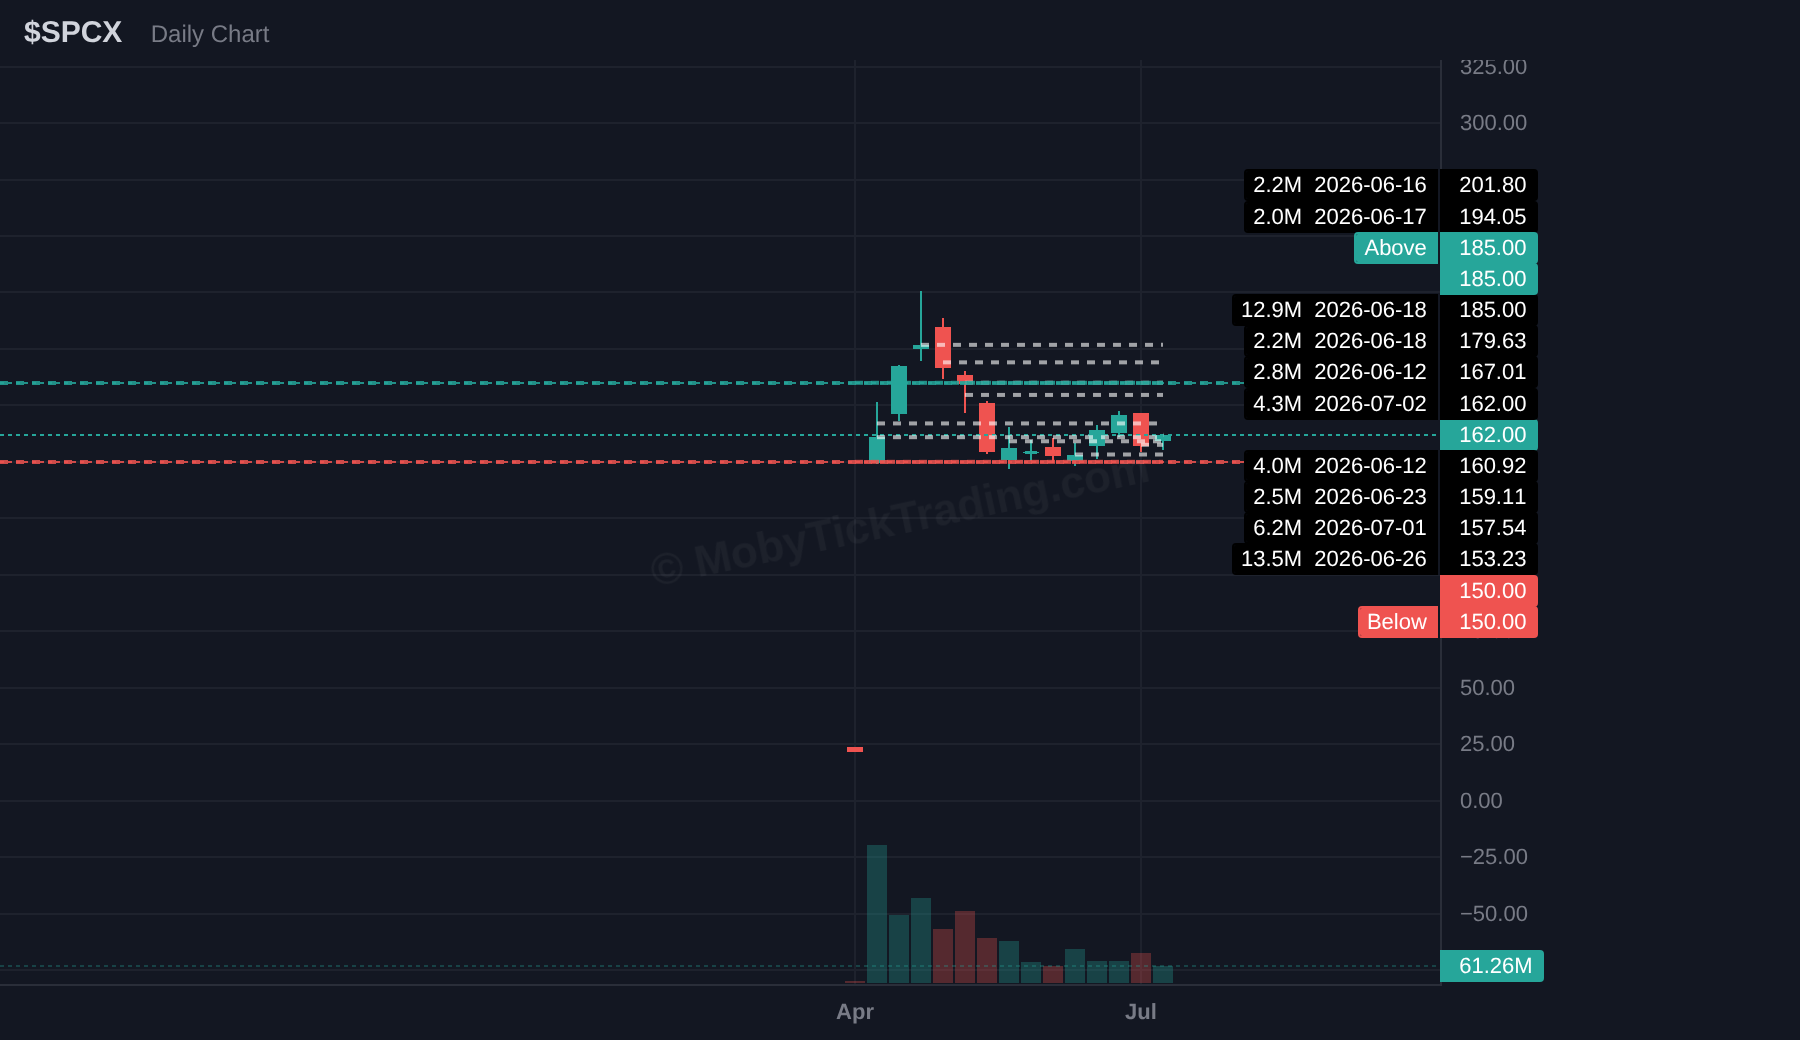
| SPCX | $185.00 | $190.00, $195.00, $200.00, $210.00, $220.00, $230.00 |
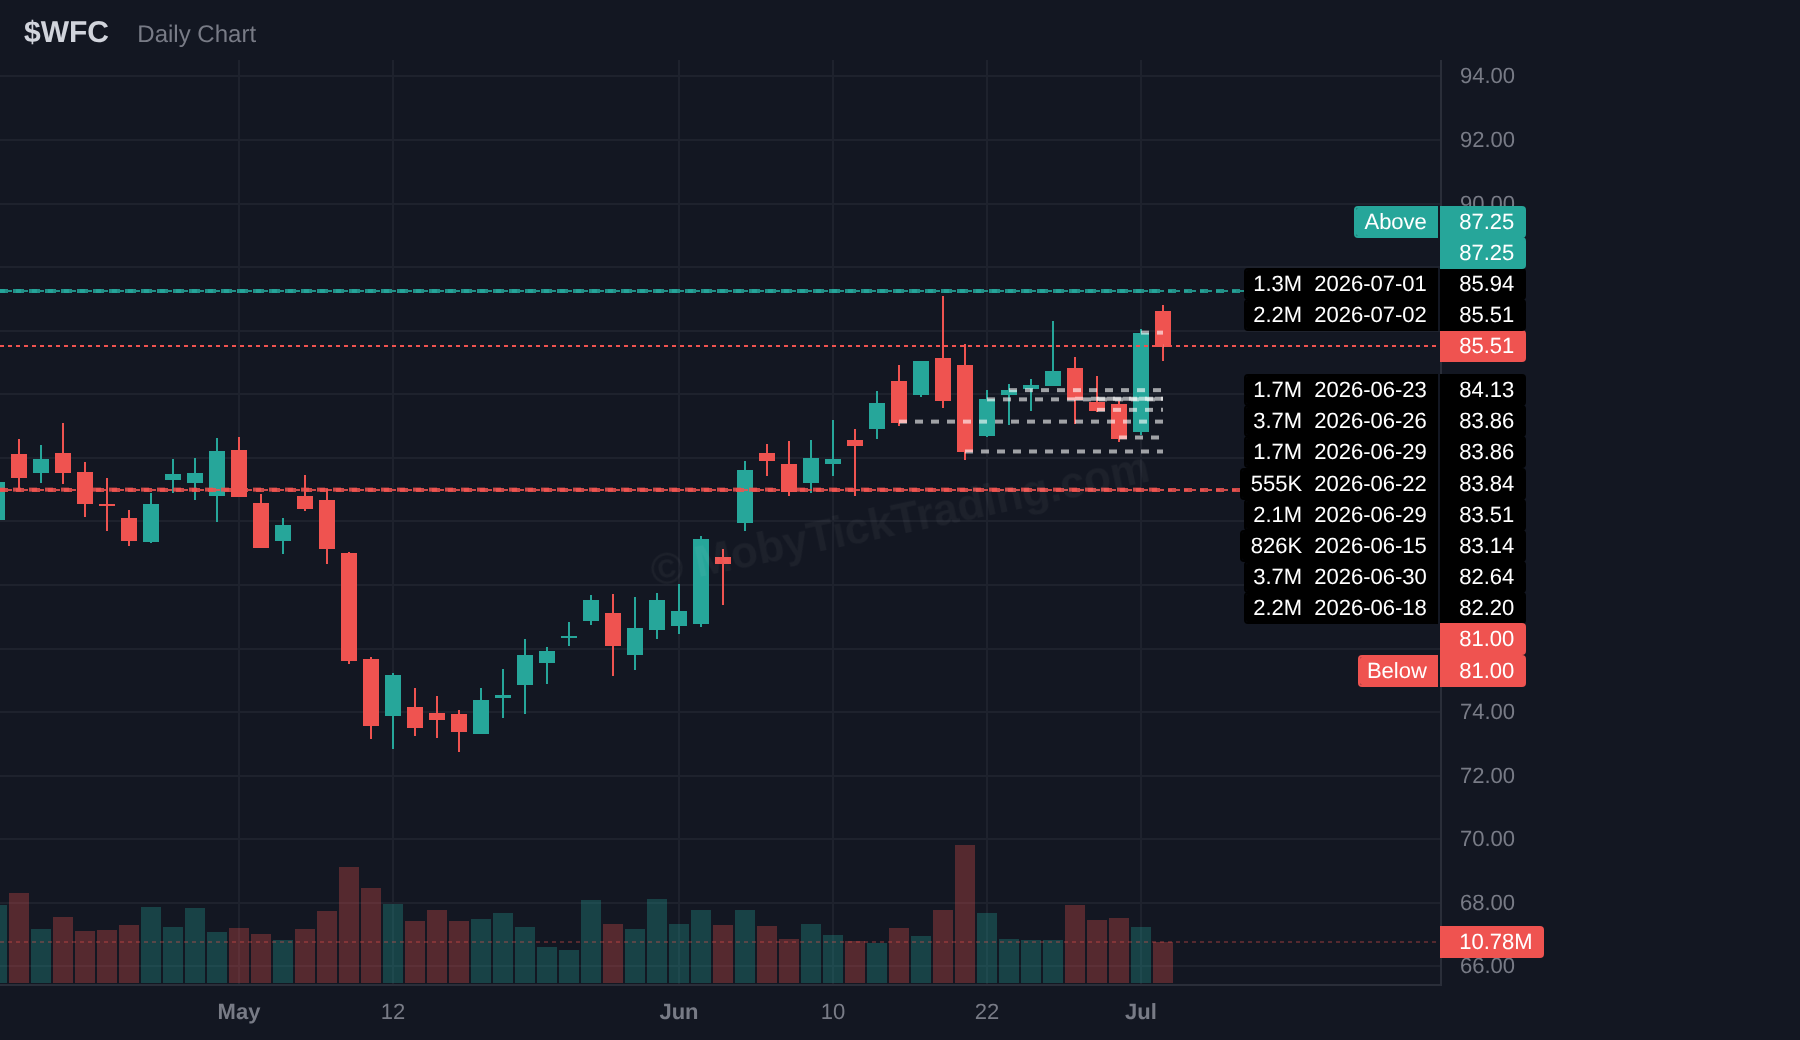
| WFC | $87.25 | $90.00, $92.50, $93.25, $95.00, $97.50, $100.00 |
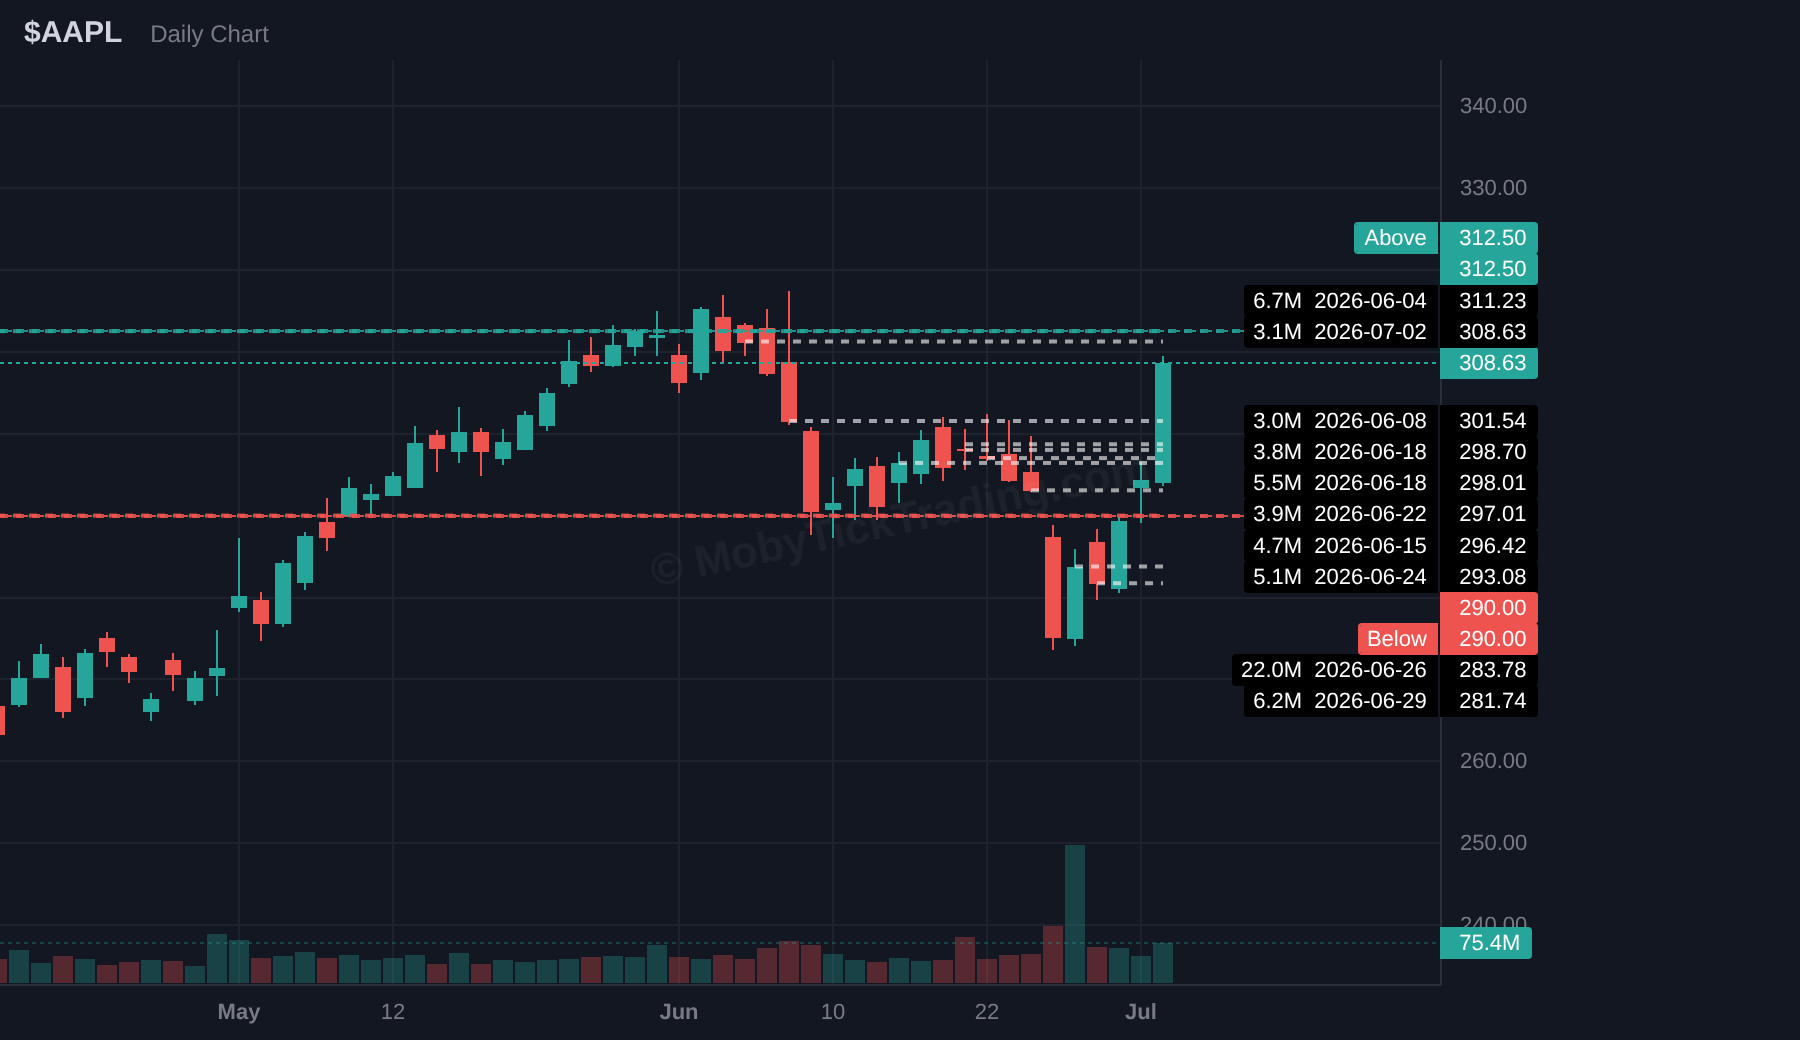
| AAPL | $312.50 | $315.00, $317.50, $320.00, $325.00, $330.00 |
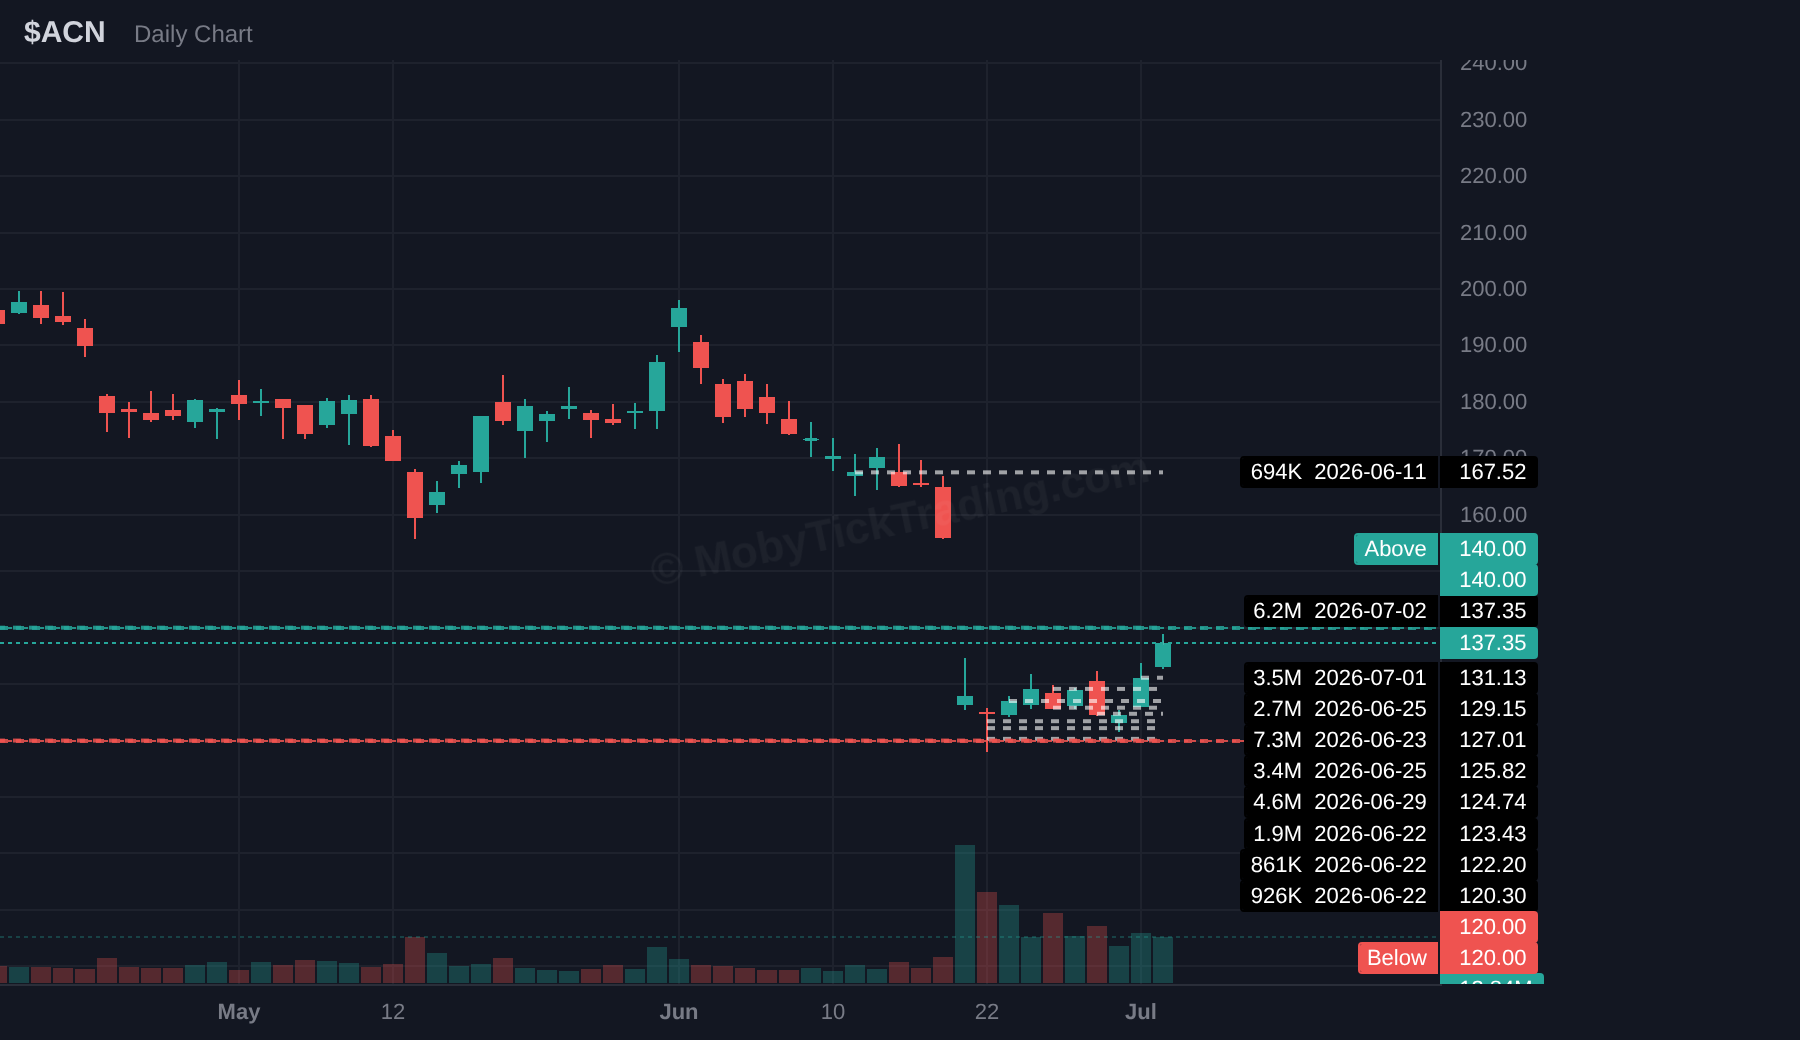
| ACN | $140.00 | $142.50, $145.00, $150.00, $155.00, $160.00, $167.50 |
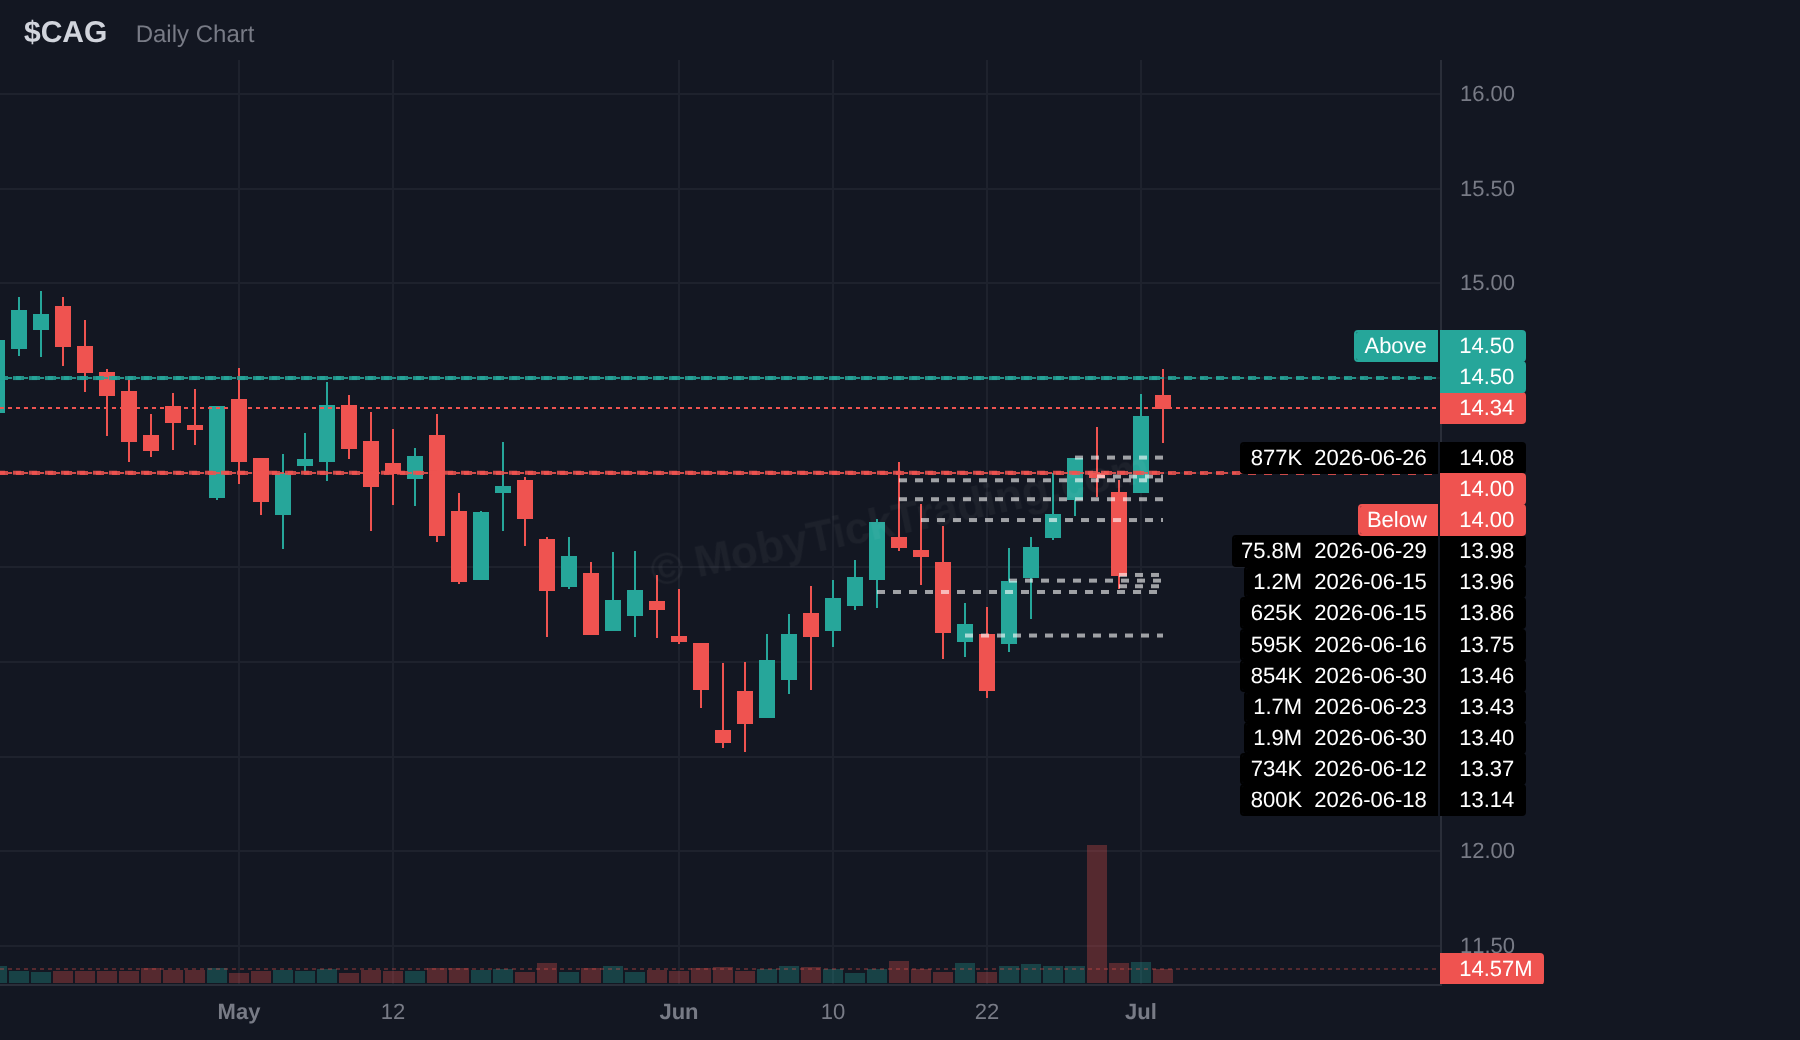
| CAG | $14.50 | $15.00, $15.50, $16.00 |
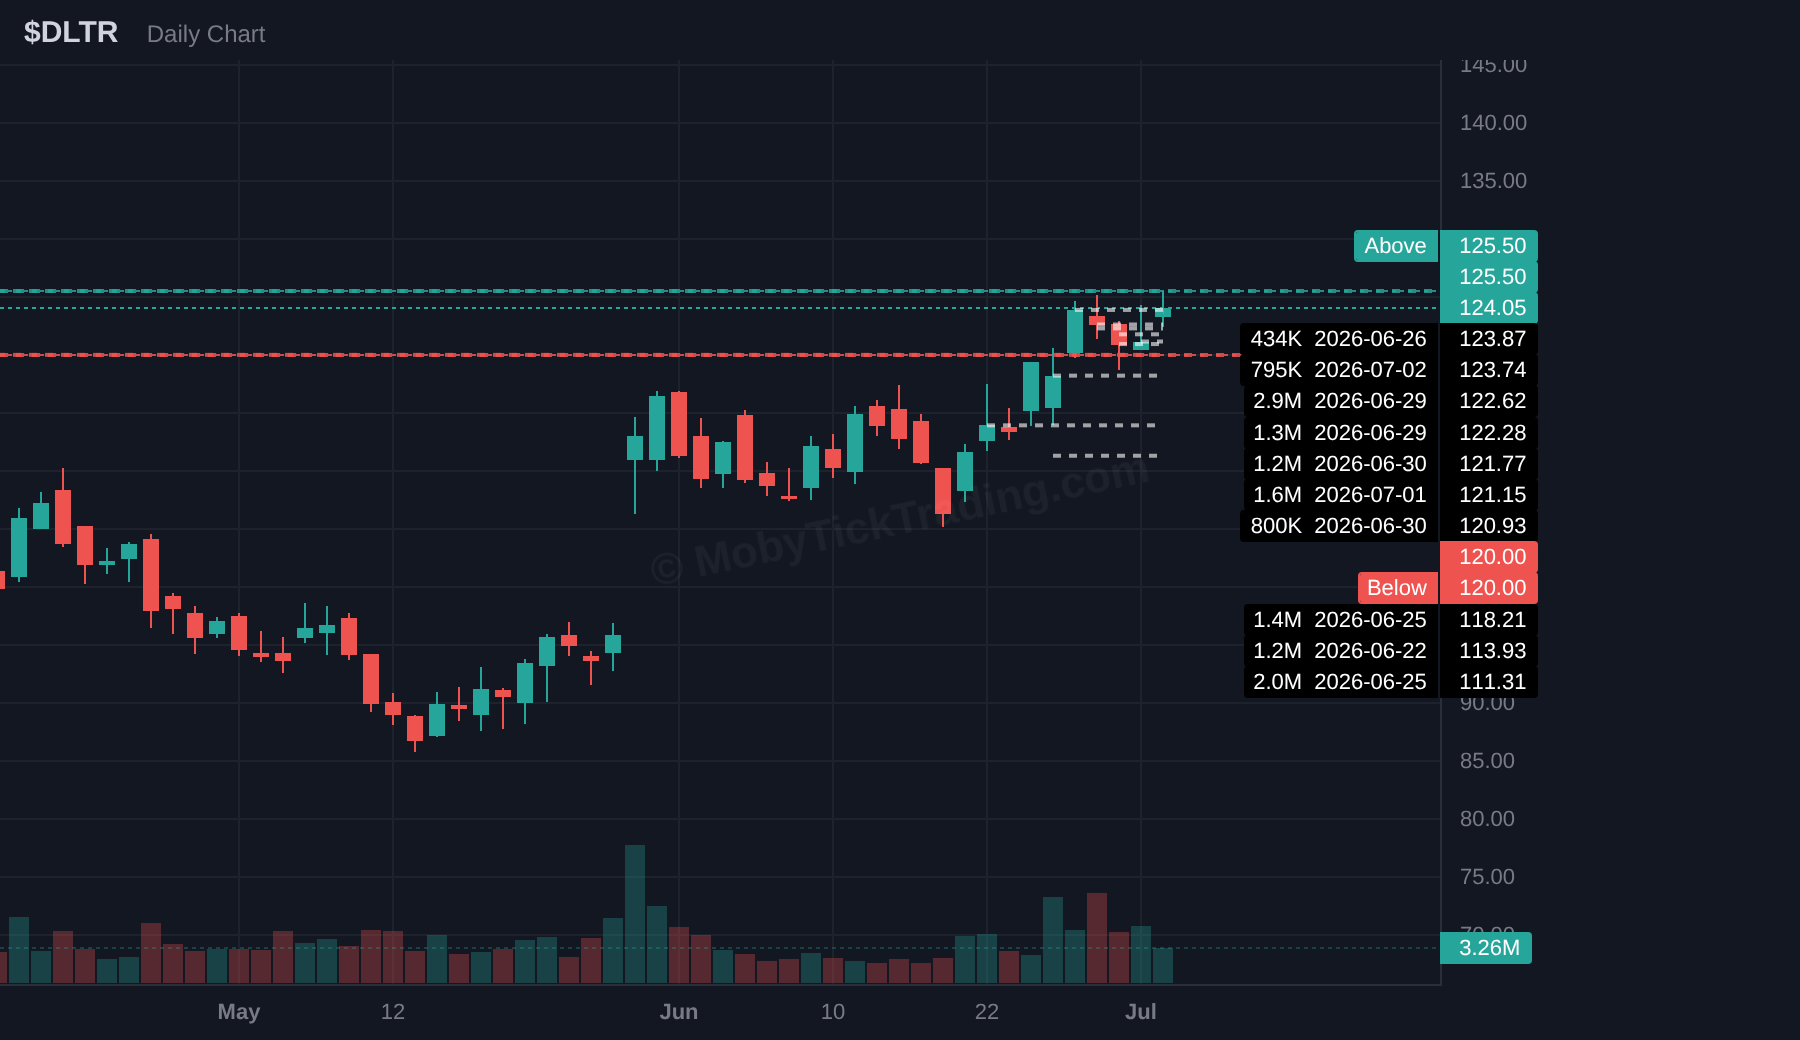
| DLTR | $125.50 | $130.00, $135.00, $140.00, $145.00 |
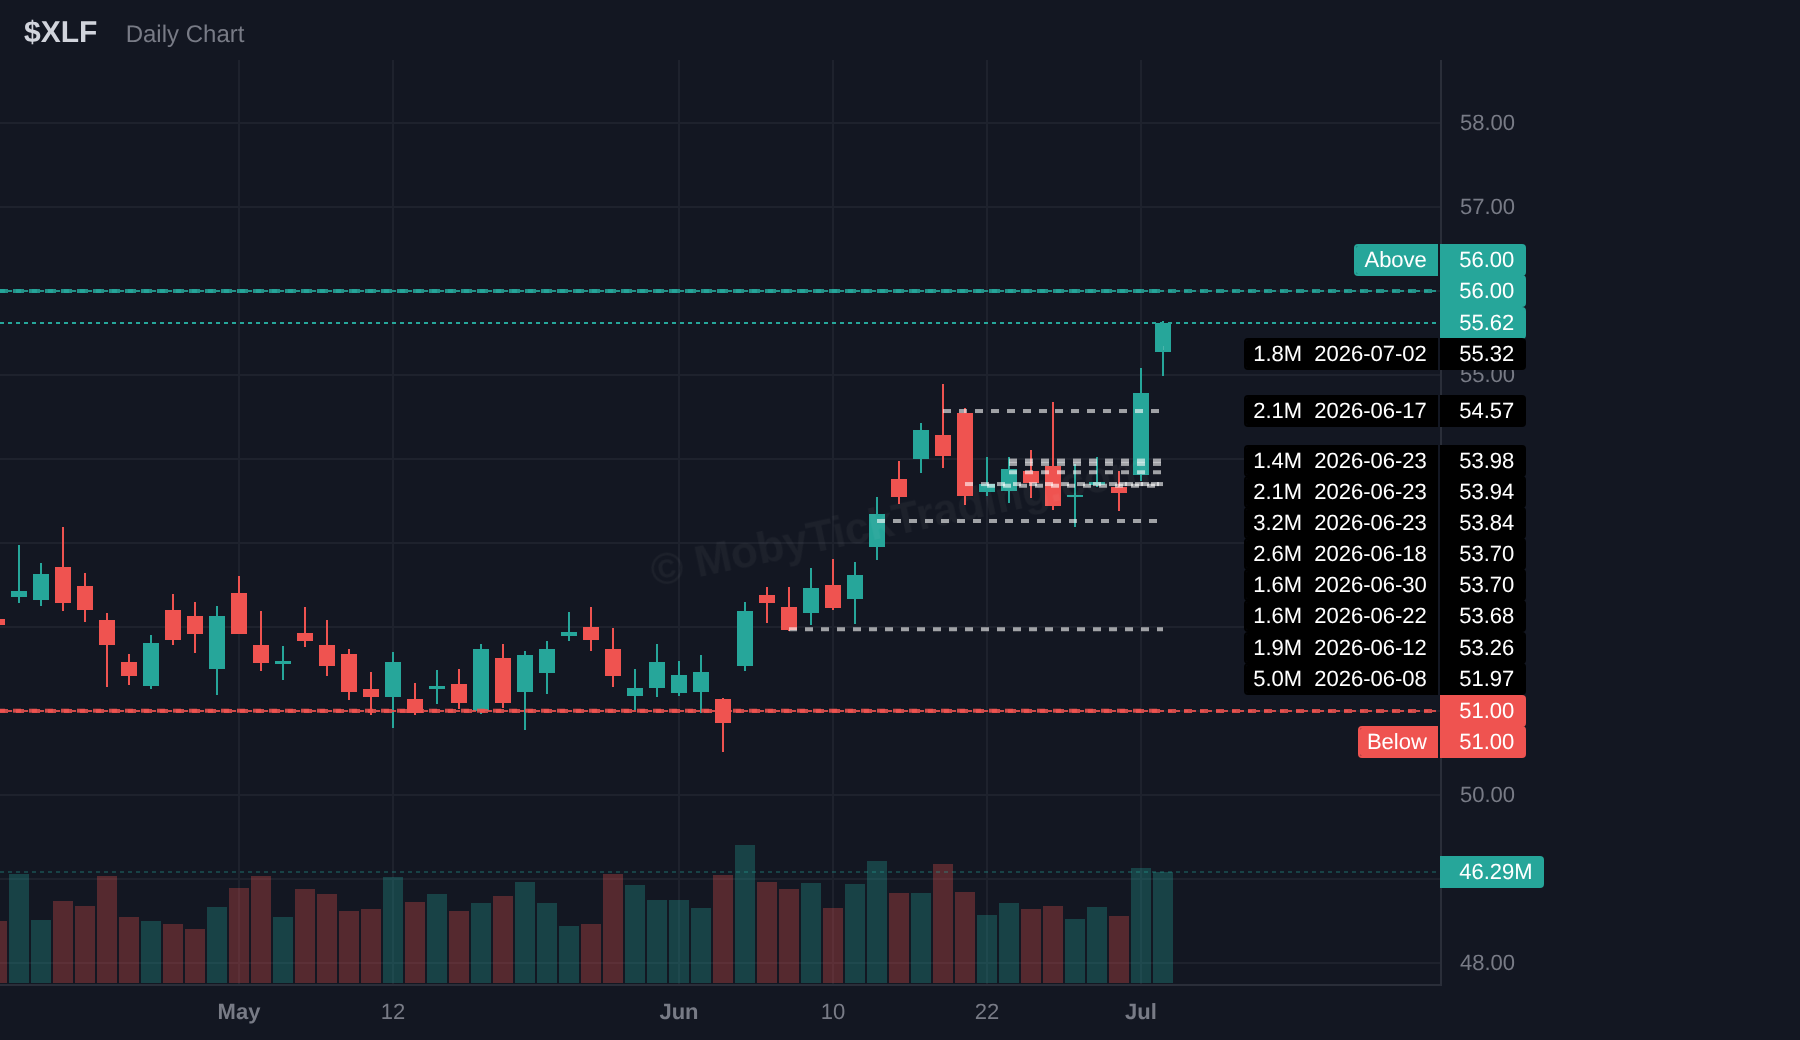
| XLF | $56.00 | $57.50, $60.00, $61.25, $62.50, $65.00 |
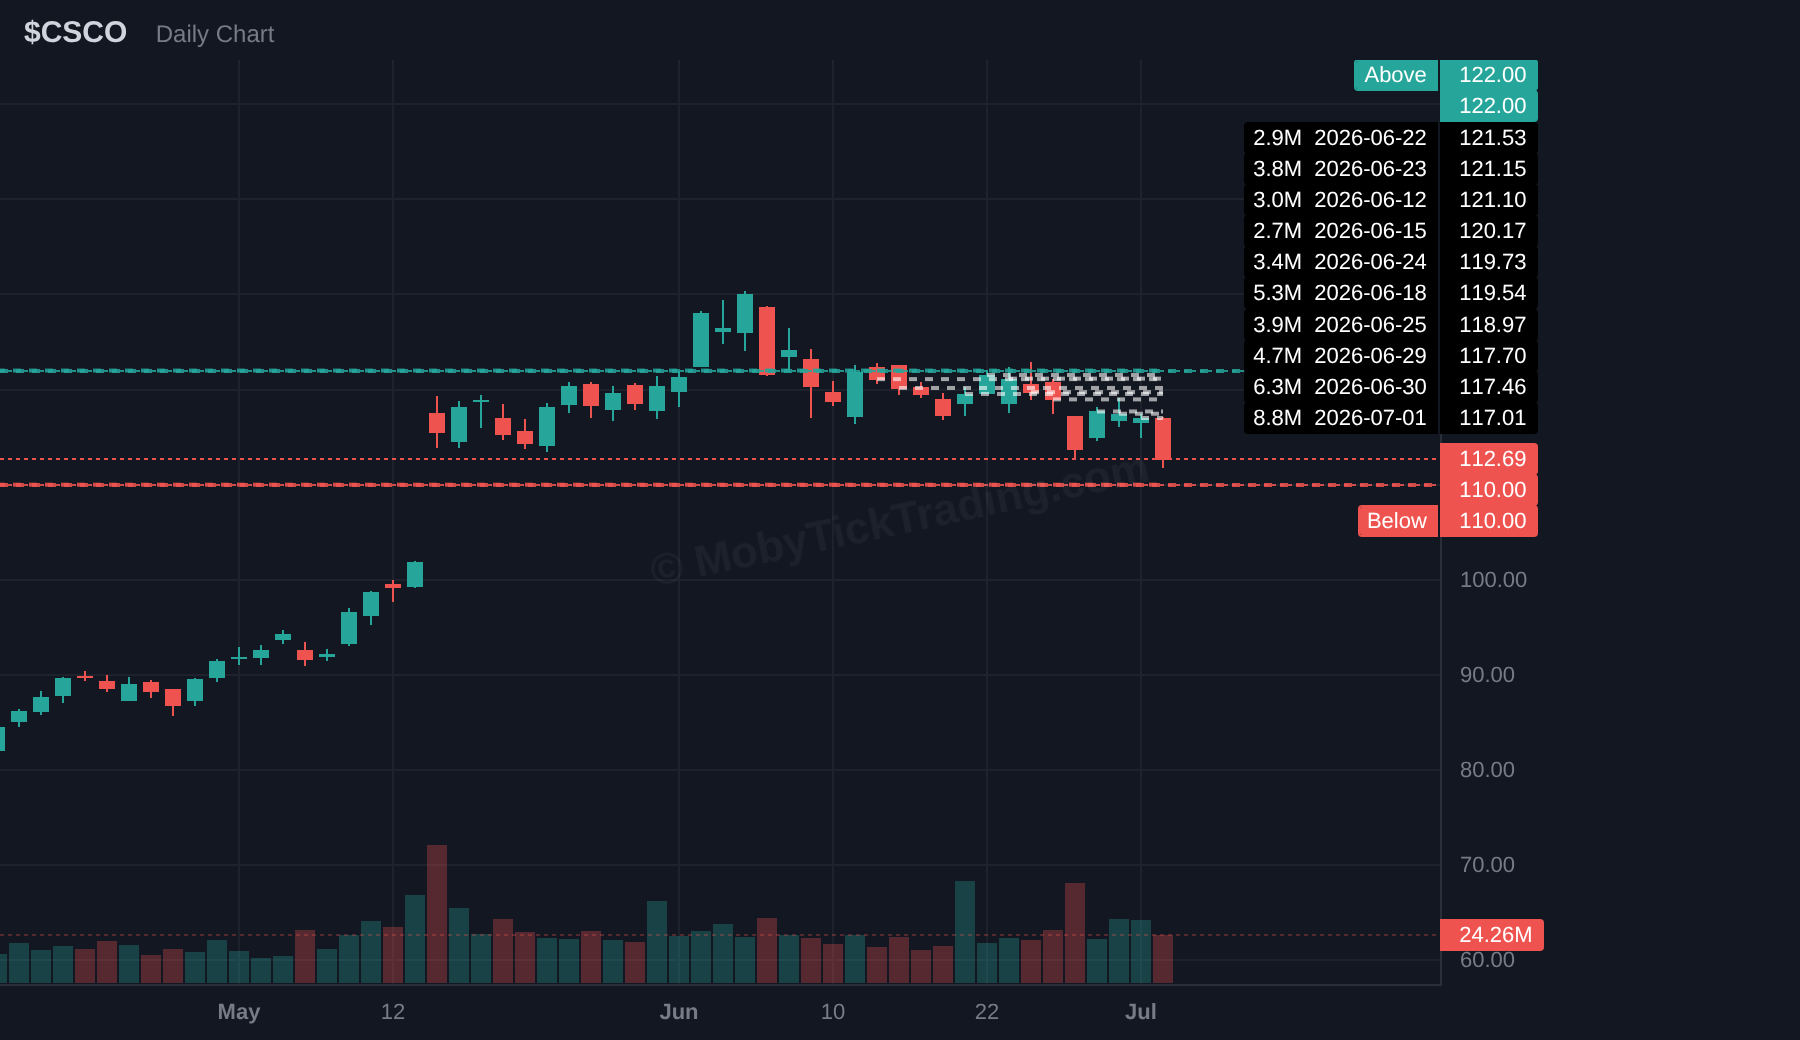
| CSCO | $122.00 | $125.00, $130.00, $135.00, $140.00, $142.50, $145.00 |
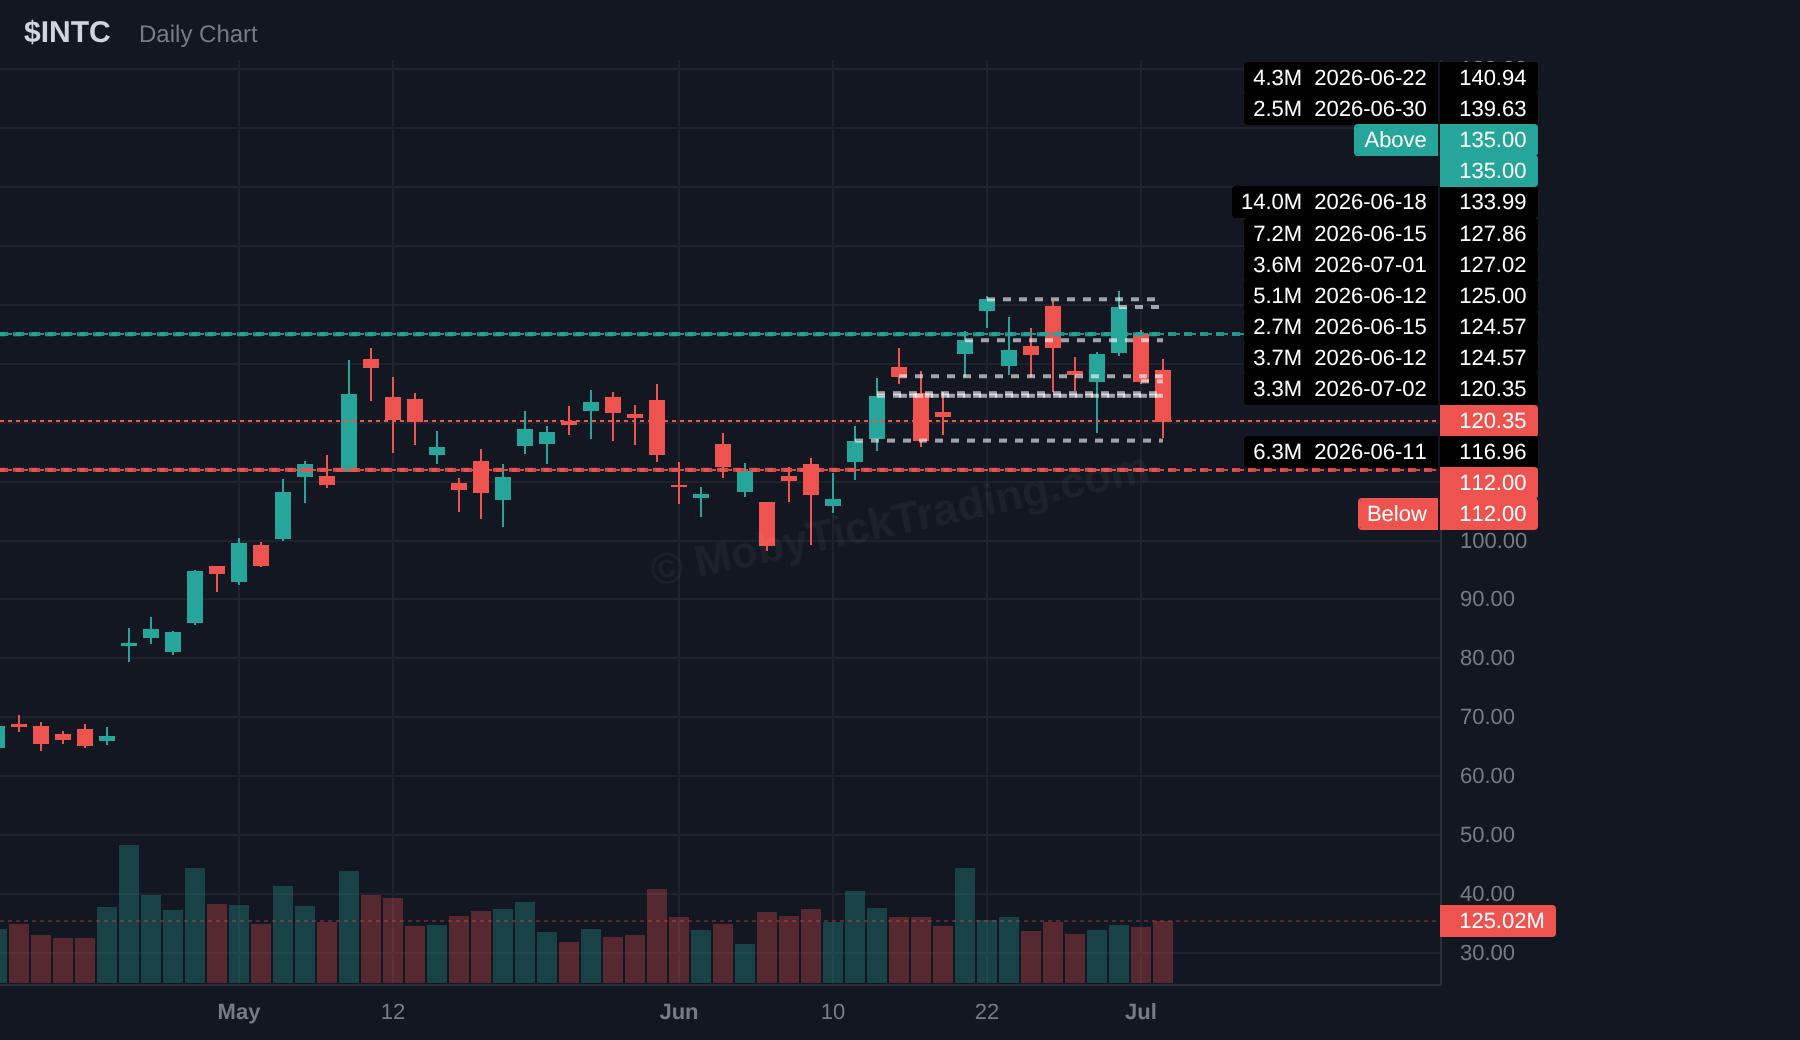
| INTC | $135 | $140, $145, $150, $155, $160 |
| Ticker | Below Trigger | Downside Targets |
|---|---|---|
| SPY | $740.00 | $735.00, $730.00, $720.00, $712.50, $705.00, $700.00 |
| QQQ | $700.00 | $695.00, $690.00, $680.00, $672.50, $655.00, $650.00 |
| IWM | $290.00 | $287.50, $285.00, $282.50, $280.00, $277.50, $275.00, $270.00 |
| MU | $950.00 | $900.00, $850.00, $800.00 |
| SPCX | $150.00 | $145.00, $140.00, $135.00, $130.00, $125.00, $120.00 |
| WFC | $81.00 | $80.00, $78.25, $77.50, $75.00, $72.50, $70.00 |
| AAPL | $290.00 | $285.00, $282.50, $280.00, $275.00 |
| ACN | $120.00 | $117.50, $115.00, $112.50, $110.00, $105.00, $100.00 |
| CAG | $14.00 | $13.50, $13.00, $12.00, $11.00, $10.00 |
| DLTR | $120.00 | $117.50, $115.00, $112.00, $111.00, $107.50, $105.00, $100.00 |
| XLF | $51.00 | $50.00, $49.00, $48.00, $47.00 |
| CSCO | $110.00 | $105.00, $100.00, $95.00, $90.00, $85.00, $80.00 |
| INTC | $112 | $107.5, $100, $95, $90, $85, $80 |
Dark pool flow for the week of June 29–July 2 (minimum 500,000-share prints, opening and closing crosses excluded). Levels shown are this week’s July 6–10 reference levels.
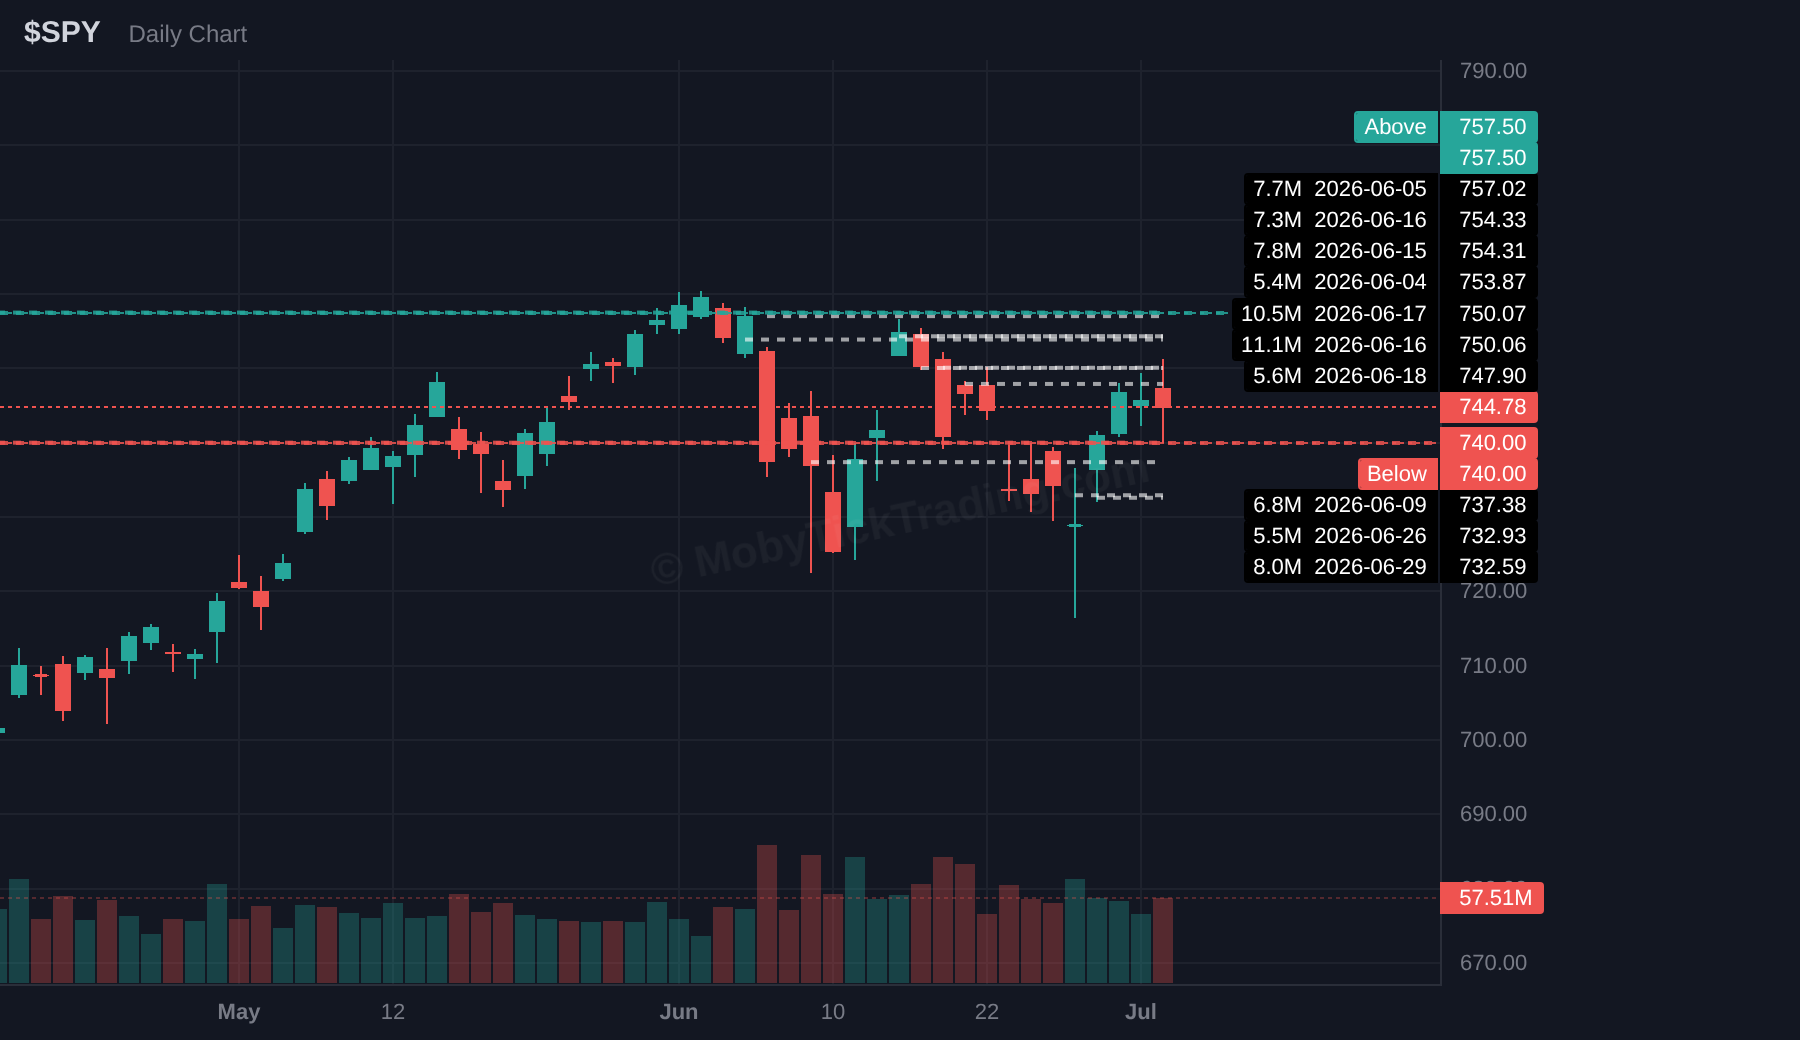
Dark pool flow: $16.96B across 22.81M shares and 20 prints. Average reported print price: $743.77. Status: BETWEEN levels.
Above $757.50 | Targets: $760.00, $765.00, $760.00, $765.00, $770.00
Below $740.00 | Targets: $735.00, $730.00, $720.00, $712.50, $705.00, $700.00
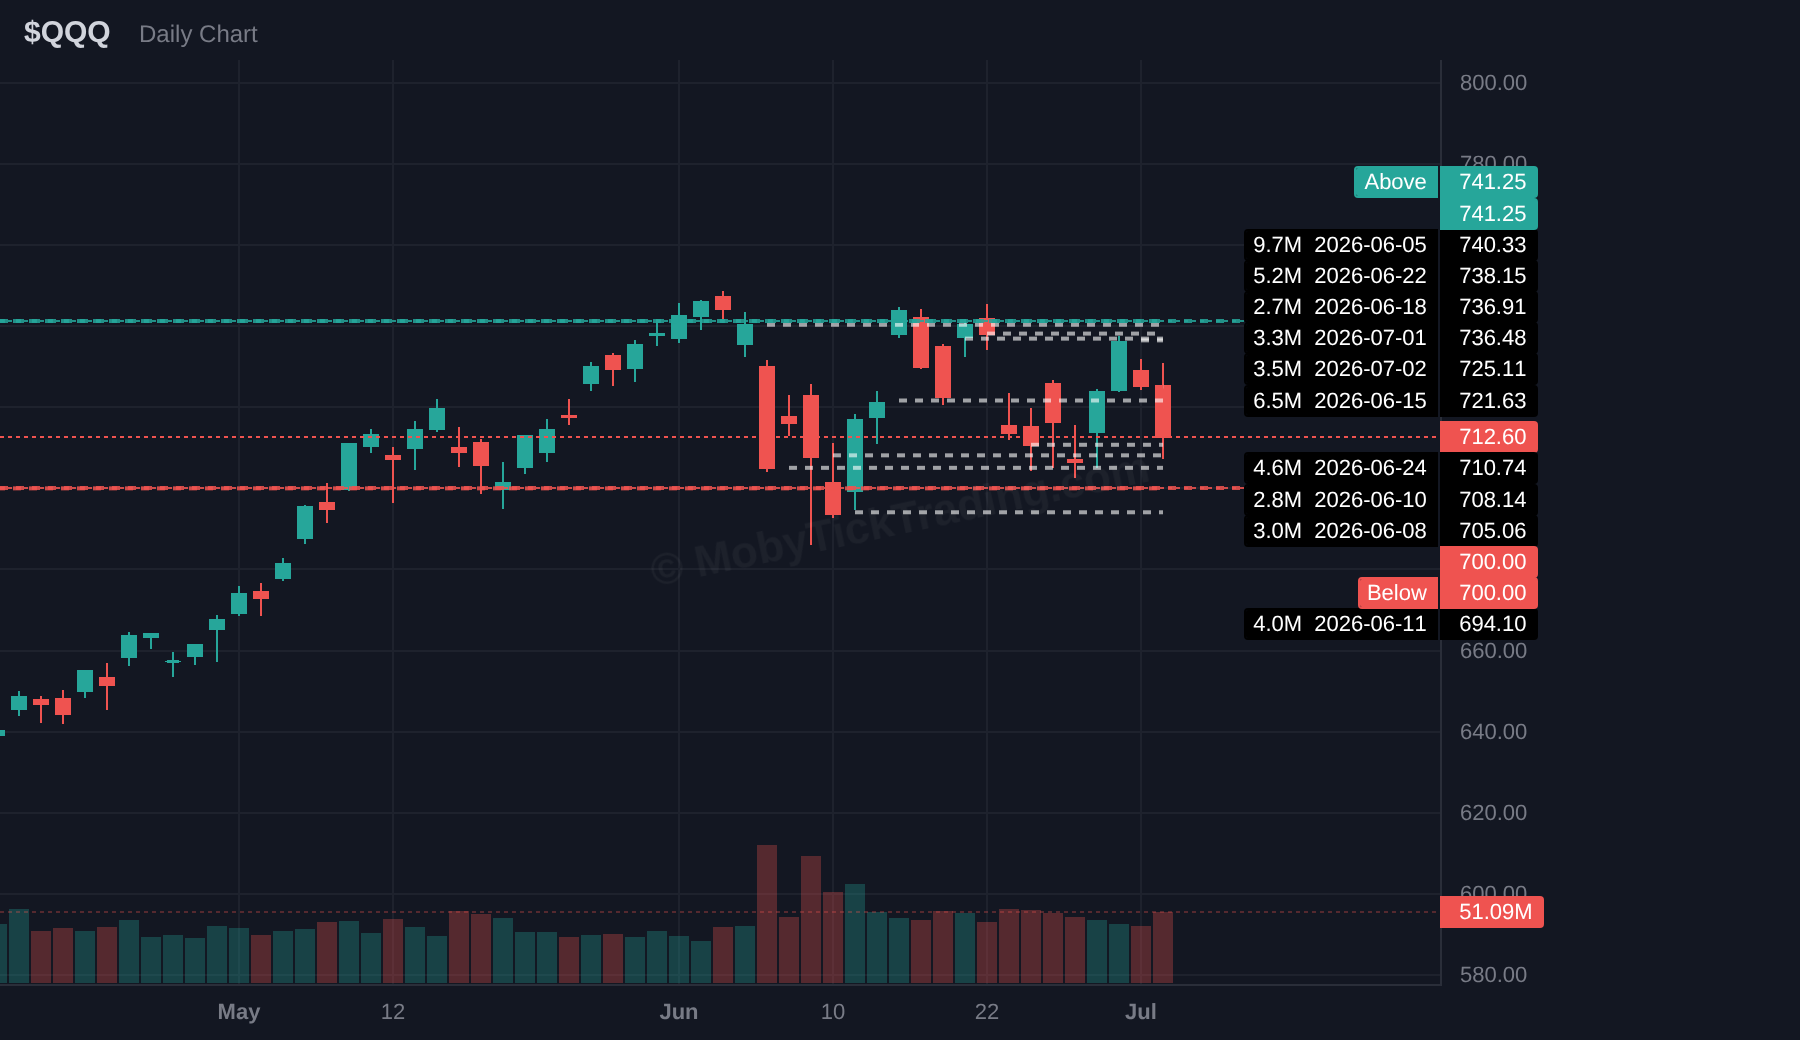
Dark pool flow: $7.78B across 10.73M shares and 11 prints. Average reported print price: $725.47. Status: BETWEEN levels.
Above $741.25 | Targets: $745.00, $750.00, $760.00, $770.00, $775.00, $780.00
Below $700.00 | Targets: $695.00, $690.00, $680.00, $672.50, $655.00, $650.00
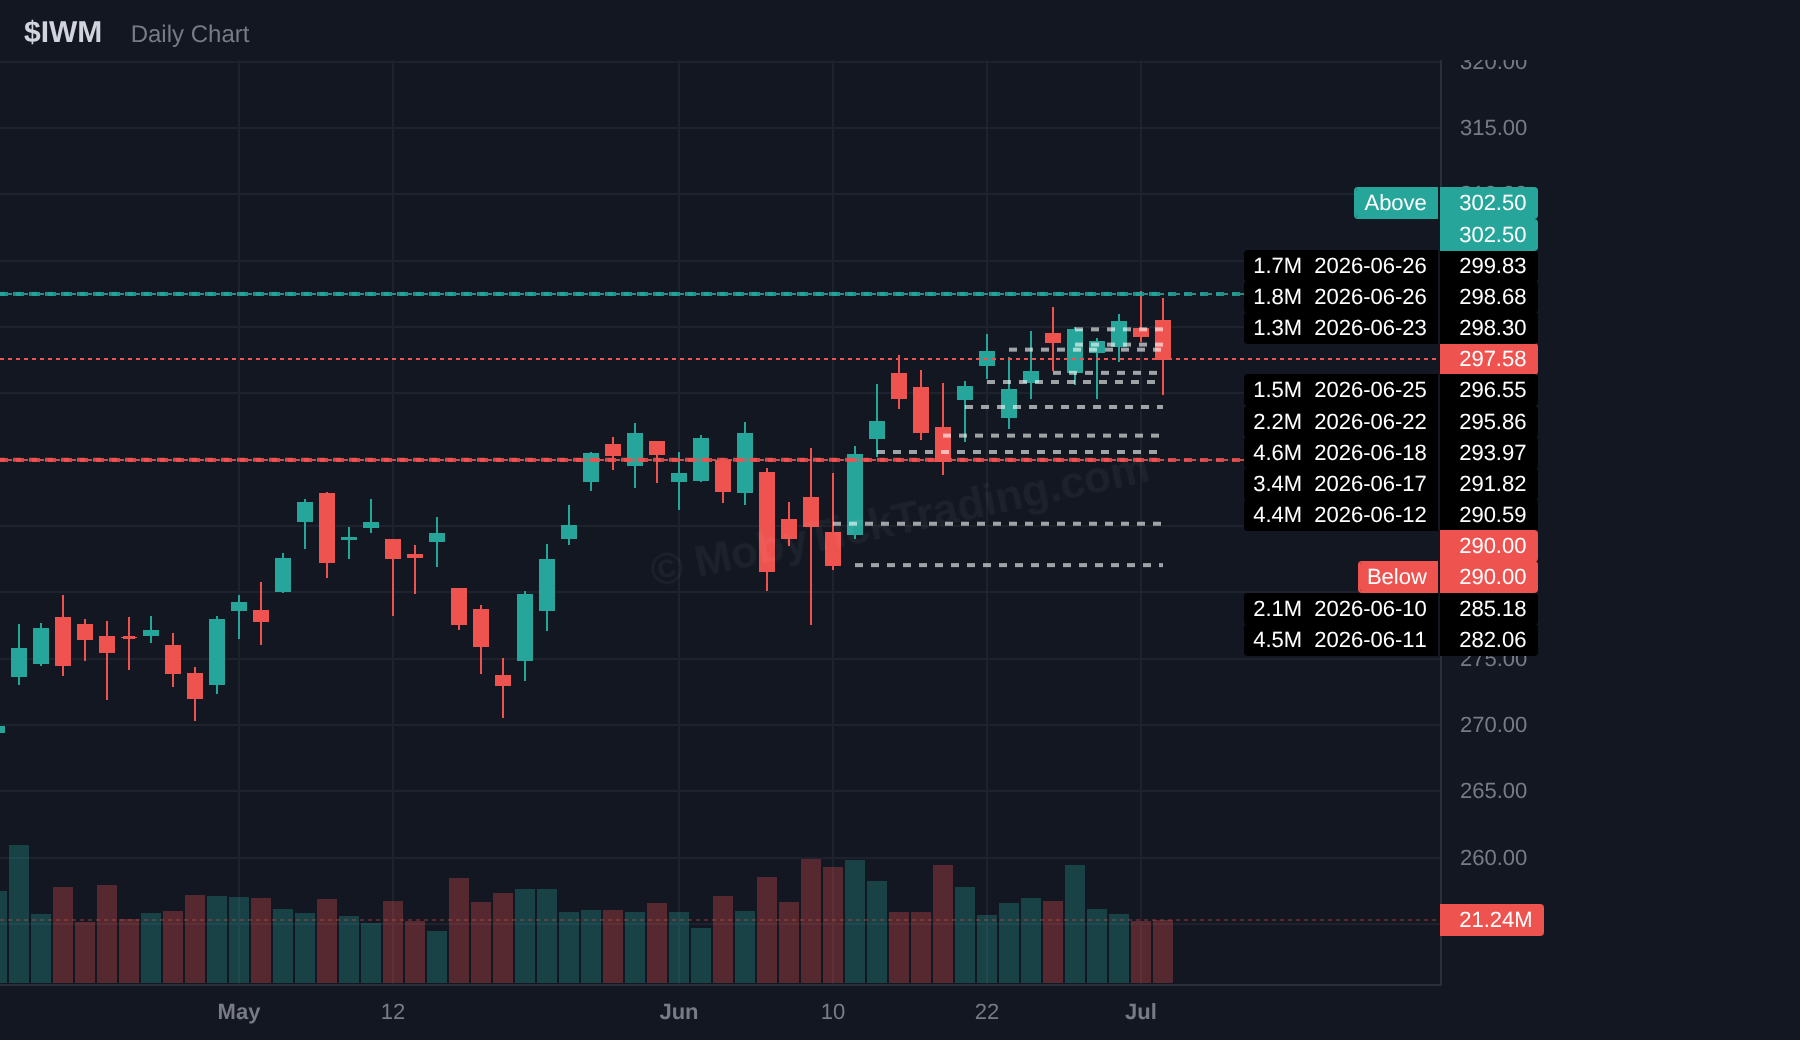
Dark pool flow: $159.2M across 0.53M shares and 1 print. Average reported print price: $300.34. Status: BETWEEN levels.
Above $302.50 | Targets: $305.00, $307.50, $310.00, $312.50, $315.00, $320.00
Below $290.00 | Targets: $287.50, $285.00, $282.50, $280.00, $277.50, $275.00, $270.00
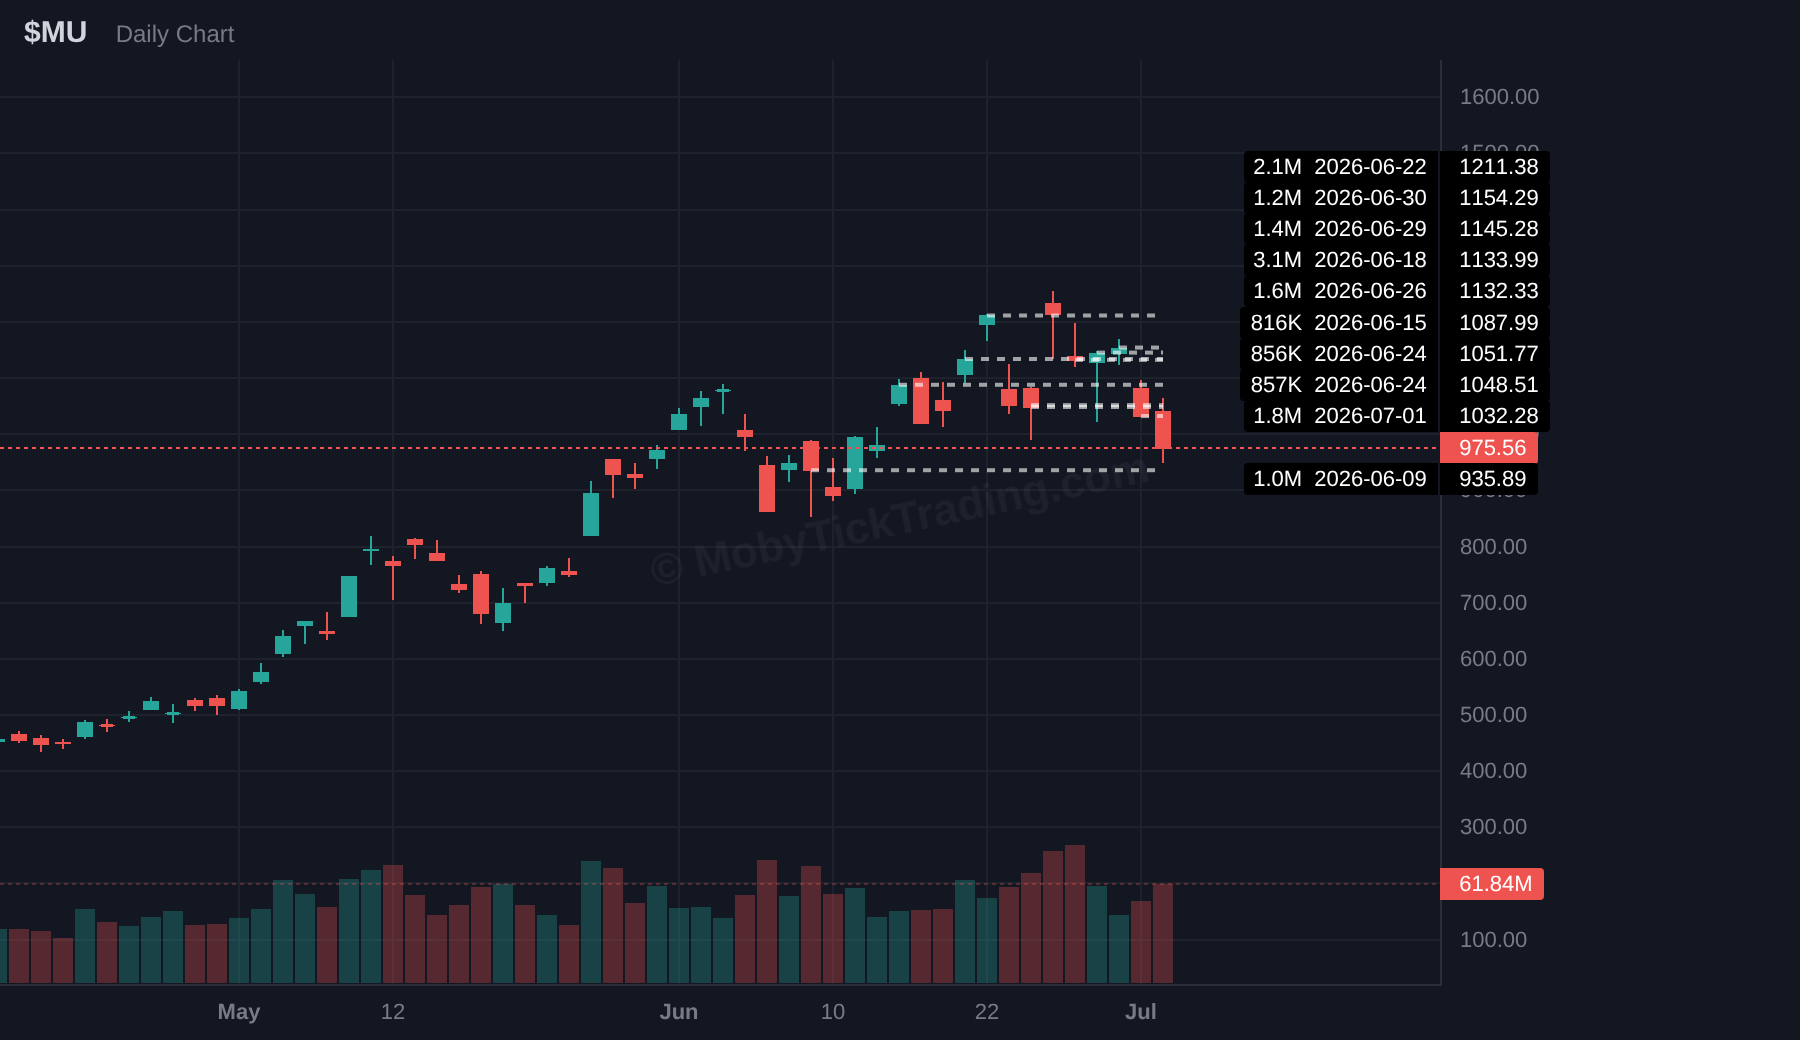
Dark pool flow: $2.43B across 2.22M shares and 2 prints. Average reported print price: $1,092.87. Status: BETWEEN levels.
Above $1,100.00 | Targets: $1,145.00, $1,200.00, $1,225.00, $1,250.00, $1,275.00, $1,300.00
Below $950.00 | Targets: $900.00, $850.00, $800.00
Dark pool flow: $2.94B across 18.17M shares and 17 prints. Average reported print price: $161.61. Status: BETWEEN levels.
Above $185.00 | Targets: $190.00, $195.00, $200.00, $210.00, $220.00, $230.00
Below $150.00 | Targets: $145.00, $140.00, $135.00, $130.00, $125.00, $120.00
Dark pool flow: $837.9M across 10.00M shares and 6 prints. Average reported print price: $83.82. Status: BETWEEN levels.
Above $87.25 | Targets: $90.00, $92.50, $93.25, $95.00, $97.50, $100.00
Below $81.00 | Targets: $80.00, $78.25, $77.50, $75.00, $72.50, $70.00
Dark pool flow: $3.02B across 10.33M shares and 7 prints. Average reported print price: $292.82. Status: BETWEEN levels.
Above $312.50 | Targets: $315.00, $317.50, $320.00, $325.00, $330.00
Below $290.00 | Targets: $285.00, $282.50, $280.00, $275.00
Dark pool flow: $1.63B across 12.37M shares and 3 prints. Average reported print price: $131.63. Status: BETWEEN levels.
Above $140.00 | Targets: $142.50, $145.00, $150.00, $155.00, $160.00, $167.50
Below $120.00 | Targets: $117.50, $115.00, $112.50, $110.00, $105.00, $100.00
Dark pool flow: $1.01B across 72.63M shares and 3 prints. Average reported print price: $13.96. Status: BELOW lower level.
Above $14.50 | Targets: $15.00, $15.50, $16.00
Below $14.00 | Targets: $13.50, $13.00, $12.00, $11.00, $10.00
Dark pool flow: $985.0M across 8.07M shares and 6 prints. Average reported print price: $122.11. Status: BETWEEN levels.
Above $125.50 | Targets: $130.00, $135.00, $140.00, $145.00
Below $120.00 | Targets: $117.50, $115.00, $112.00, $111.00, $107.50, $105.00, $100.00
Dark pool flow: $721.2M across 13.21M shares and 16 prints. Average reported print price: $54.60. Status: BETWEEN levels.
Above $56.00 | Targets: $57.50, $60.00, $61.25, $62.50, $65.00
Below $51.00 | Targets: $50.00, $49.00, $48.00, $47.00
Dark pool flow: $2.14B across 18.20M shares and 4 prints. Average reported print price: $117.33. Status: BETWEEN levels.
Above $122.00 | Targets: $125.00, $130.00, $135.00, $140.00, $142.50, $145.00
Below $110.00 | Targets: $105.00, $100.00, $95.00, $90.00, $85.00, $80.00
Dark pool flow: $1.37B across 10.58M shares and 7 prints. Average reported print price: $129.03. Status: BETWEEN levels.
Above $135 | Targets: $140, $145, $150, $155, $160
Below $112 | Targets: $107.5, $100, $95, $90, $85, $80
The index level barely moved, but the block tape did not sit still. MobyTick data for the week of June 29 – July 2 shows broad-market ETFs (SPY, QQQ, IWM, VOO, IVV) carrying roughly $30.6 billion in dark pool notional, with the sector SPDRs adding another $3.1 billion on top. That is where the week’s real story lived — beneath a headline surface where the Dow set records, the S&P finished near unchanged mid-week, and the Nasdaq lagged on a sharp semiconductor drawdown.
SPY topped every ticker on the tape, printing on the order of $17 billion across about 22.8 million shares at a volume ratio near 0.4x. The size confirms what price action masked: while the S&P closed the week roughly flat-to-up, institutional block activity moved through the venue at scale as leadership shifted from semiconductors toward financials, healthcare, and staples.
QQQ carried more than $7.8 billion across roughly 10.7 million shares at a low 0.2x volume ratio. Nasdaq-exposure flow moved even as the underlying tech and semiconductor complex took its worst stretch in months — the VanEck semiconductor group fell in the high-single-digit percent range on the week, with Micron’s single-session move headlining the rout. The QQQ block flow ran quietly against that visible weakness rather than alongside a panic; index-level VIX stayed contained near 16 while single-name volatility spiked.
The standout anomaly was SPCX, a normally low-volume SPDR that registered roughly $2.9 billion across about 18.2 million shares. Its volume ratio came in near 7,891x — an extraordinary reading that flagged the print as massive against its typical baseline. That kind of ratio, on a name that rarely draws institutional block size, is the clearest single ETF signal on the week and warrants attention on its own.
The week’s macro pivot — a soft June payrolls print of +57,000 that collapsed the Fed’s hiking bias and repriced the rates conversation dovish — set up a tailwind for rate-sensitive small caps and financials. IWM did not surface among the top notional names, so its dark pool footprint stayed modest relative to the mega-liquidity ETFs even as the small-cap trend caught the rotation. On the sector side, SPDR block flow totaled about $3.1 billion and was led by energy (XLE, roughly $733 million) rather than a single dominant financial print, underscoring that the financials-led Dow record ran on breadth across the value complex rather than one concentrated ETF flow.
The takeaway from the ETF tape: calm indexes, heavy blocks, and a rotation moving through the venue while the record close grabbed the headlines.
This past week gave us one of the cleanest teaching examples of the year. On the surface, the market looked calm and even celebratory — the Dow closed at a record high and finished the week up roughly 2%. But underneath that headline, something very different was happening. Semiconductors were getting hammered, with the semi complex down around 7% on the week and Micron alone falling about 13% in a single session, while financials, healthcare, and value names quietly caught the flows. That gap between the calm index and the violent move beneath it is what we call a sector rotation, and it is exactly the kind of shift dark pool block trades tend to reveal before the headline narrative catches up.
Institutions rarely chase price. When a large player wants to build or exit a position measured in billions, doing it on the open exchange would move the price against them. So they work quietly in dark venues, breaking flow into blocks that don’t tip their hand. When you watch this activity across a full week, a pattern emerges: consistent block buying in one group of sectors and consistent block selling in another, even while the index barely moves.
That is rotation. One neighborhood of the market is being accumulated while another is being distributed, and it is happening before the move becomes obvious on the tape.
The rotation didn’t start with the June payrolls report — but that report poured fuel on it. Nonfarm payrolls came in at just +57,000, roughly half of what economists expected, with unemployment ticking to 4.2%. That miss knocked the Fed’s hiking bias off the table and flipped the rates conversation dovish. Rate-sensitive value, financials, and small caps got rewarded, while richly valued growth and semis de-rated. The important point for our readers: the block flow was already leaning this direction before the number hit. The catalyst didn’t create the rotation. It confirmed one that was already underway.
You could see both sides of the trade in the week’s activity. On the distribution side, Nvidia carried enormous block flow — roughly $12 billion in dark pool volume across tens of millions of shares — and Micron showed sizable block activity into its worst session. On the accumulation side, financials lit up: Citigroup and JPMorgan both drew heavy institutional blocks, with Citigroup’s flow running noticeably hotter than its typical daily volume.
MobyTick thinks about this through a volume ratio — how large a name’s block flow is relative to its normal trading. When a financial name suddenly trades well above its usual block volume while a crowded semi trades quietly beneath the surface, that contrast is the fingerprint of rotation.
The practical takeaway is simple:
The Dow made the headlines this week. The rotation underneath is where the real information lived.
MobyTick surfaces the institutional dark pool block trades that move markets before the tape catches up. Get weekly setups, callout levels, and rotation signals delivered straight to your inbox.