
Market Overview
Utilities, energy and staples led the week, and the S&P 500 set a record close of 7,818.93 on October 6 before giving ground into Friday.
| ETF | Open | High | Low | Close | Week |
|---|---|---|---|---|---|
| SPY | 769.69 | 781.62 | 769.63 | 778.57 | +1.15% |
| QQQ | 749.35 | 762.86 | 743.23 | 751.27 | +0.26% |
| IWM | 281.95 | 284.64 | 274.52 | 278.94 | -1.07% |
| DIA | 510.37 | 517.03 | 507.84 | 516.11 | +1.12% |
SPY added 1.15% and DIA 1.12%, while QQQ lagged at 0.26% and IWM was the only one of the four to fall, down 1.07%. The S&P 500 also set an intraday record of 7,844.52 during the week.
The 10-year Treasury yield topped 5.36% intraday on October 7 and closed the week at 5.27%, still near its highest level since 2002. The 30-year yield closed at 5.698% on October 5, a 24-year high, and ended the week near 5.6%. The Federal Reserve’s September meeting minutes, released October 7, showed officials split on why they raised rates: some cited energy and price shocks, others demand-driven inflation. The next FOMC meeting is October 27 to 28.
WTI fell to $88.28 on October 7, its low for the week, and settled at $91.85 on October 9, with Brent at $104.72. December gold hit a two-month low of $4,140.70 on October 7 and settled at $4,216.30 on October 9.
| Date | Event |
|---|---|
| Oct 5 | Brazil’s presidential first round sent PBR to a $23.98 open, 10.8% above its October 2 close of $21.65. ISM services came in at 54.9. |
| Oct 6 | The S&P 500 set a record close of 7,818.93. |
| Oct 7 | The Fed released its September minutes; the 10-year yield traded above 5.36%. |
| Oct 8 | A report put OpenAI’s annualized revenue near $50 billion, against $70 billion previously reported. OpenAI-linked names including MSFT and NVDA fell, and QQQ closed 1.34% lower. |
| Oct 9 | MRNA joined the Nasdaq-100 before the open and closed at $225.00. University of Michigan sentiment came in at 46.3. |
Utilities gained 3.88%, energy 3.72% and staples 3.63%, while semiconductors fell 4.46% and technology 0.74%. Health care added 2.90% and financials 2.30%. Real estate rose 2.06% and gold 1.02%. Four sector funds finished lower: semiconductors 4.46%, biotech 1.15%, technology 0.74% and industrials 0.23%. Communication services was the weakest gainer at plus 0.15%.
Across all names, dark pool notional totaled $226.34B over 16,597 aggregated print levels at or above 50,000 shares, with prints at the exact daily closing price excluded. The broad and sector ETF basket was heaviest on October 8 at $15.72B and lightest on October 9 at $8.04B.
Dark pool footprint of the 13 callouts:
| Ticker | DP notional | Shares | Levels |
|---|---|---|---|
| SPY | $24.61B | 31.73M | 49 |
| QQQ | $21.53B | 28.52M | 90 |
| MDT | $7.60B | 86.88M | 89 |
| IWM | $4.22B | 15.10M | 60 |
| NVDA | $3.14B | 13.38M | 61 |
| MSFT | $2.17B | 4.09M | 21 |
| XLU | $0.82B | 20.06M | 56 |
MDT carried the highest dark pool ratio of the 13 callouts, at 4.145 times its 30-day average daily volume, on 86.88M shares across 89 levels. The week overlapped the close of Medtronic’s MiniMed exchange offer. The company set the final exchange ratio at 4.5939 on October 7, and the offer expired at midnight New York time at the end of October 9.
Last two weeks’ levels
The scorecard covers two weeks, from September 28 through October 9, because the previous week’s report was skipped. Of the prior issue’s 13 callouts, seven triggered on the Above side, five on the Below side, and one did not trigger. Seven names reached at least one target, for 21 targets hit in total. INTC hit all 6 of its targets, falling from its $119.00 Below trigger to a $104.00 low. MRNA hit 5 of 6, running from its $202.50 Above trigger to $225.00. MSFT reached its fourth target at $535.00 and SPY its second at $780.00.
Data sourced from MobyTick.
Last Week’s Callout Performance
| Ticker | Above | Below | High | Low | Close | Triggered | Targets Hit | Move From Trigger |
|---|---|---|---|---|---|---|---|---|
| SPY | $775.00 | $757.50 | $781.62 | $758.79 | $778.57 | Above | 2 of 4 → T2 ($780.00) | $775.00 → $781.62 (+0.85%) |
| QQQ | $748.50 | $734.00 | $762.86 | $731.63 | $751.27 | Above | 3 of 5 → T3 ($760.00) | $748.50 → $762.86 (+1.92%) |
| IWM | $290.00 | $279.00 | $284.64 | $274.52 | $278.94 | Below | 2 of 6 → T2 ($275.00) | $279.00 → $274.52 (-1.61%) |
| WBD | $31.00 | $30.00 | $30.99 | $30.79 | $30.95 | None | Not triggered | — |
| MSFT | $520.00 | $490.00 | $537.22 | $502.22 | $535.07 | Above | 4 of 6 → T4 ($535.00) | $520.00 → $537.22 (+3.31%) |
| MU | $1,112.50 | $1,035.00 | $1,108.00 | $1,011.42 | $1,029.00 | Below | 1 of 5 → T1 ($1,025.00) | $1,035.00 → $1,011.42 (-2.28%) |
| AMD | $640.00 | $600.00 | $658.52 | $596.07 | $608.10 | Above | 1 of 6 → T1 ($650.00) | $640.00 → $658.52 (+2.89%) |
| INTC | $127.50 | $119.00 | $126.00 | $104.00 | $104.70 | Below | 6 of 6 → T6 ($105.00) | $119.00 → $104.00 (-12.61%) |
| SMCI | $44.00 | $39.75 | $45.77 | $40.13 | $41.85 | Above | 1 of 4 → T1 ($45.00) | $44.00 → $45.77 (+4.02%) |
| MRNA | $202.50 | $175.00 | $225.00 | $182.50 | $225.00 | Above | 5 of 6 → T5 ($225.00) | $202.50 → $225.00 (+11.11%) |
| ALHC | $8.50 | $7.36 | $8.79 | $6.01 | $7.54 | Below | 2 of 5 → T2 ($6.50) | $7.36 → $6.01 (-18.34%) |
| IONQ | $47.00 | $40.00 | $47.91 | $38.83 | $39.89 | Below | 1 of 5 → T1 ($39.00) | $40.00 → $38.83 (-2.92%) |
| PYPL | $55.50 | $51.75 | $55.68 | $52.30 | $55.53 | Above | 0 of 6 | $55.50 → $55.68 (+0.32%) |
Bullish Setups — Above Trigger
| Ticker | Above Trigger | Targets |
|---|---|---|
| SPY | $780.00 | $782.50 → $785.00 → $790.00 → $795.00 → $800.00 |
| QQQ | $762.50 | $765.00 → $770.00 → $775.00 → $780.00 → $785.00 → $800.00 |
| IWM | $282.50 | $284.00 → $285.00 → $287.50 → $290.00 |
| MDT | $90.00 | $91.00 → $92.50 → $94.00 → $95.00 |
| NVDA | $235 | $237.5 → $239.25 → $240 → $242.5 → $245 → $247.5 → $250 |
| PLTR | $210 | $212.5 → $215 → $217.5 → $220 → $225 → $230 |
| TSLA | $390 | $392.5 → $395 → $400 → $402.5 → $405 |
| WMT | $113 | $114 → $115 → $117.5 → $120 |
| MRNA | $226 | $230 → $235 → $240 → $245 → $250 → $255 → $260 |
| AMZN | $263.25 | $265 → $270 → $272.5 → $275 → $280 |
| MSFT | $537.5 | $540 → $545 → $550 → $555 → $560 |
| PBR | $25.5 | $26 → $26.5 → $27 → $27.5 → $28 → $29 → $30 |
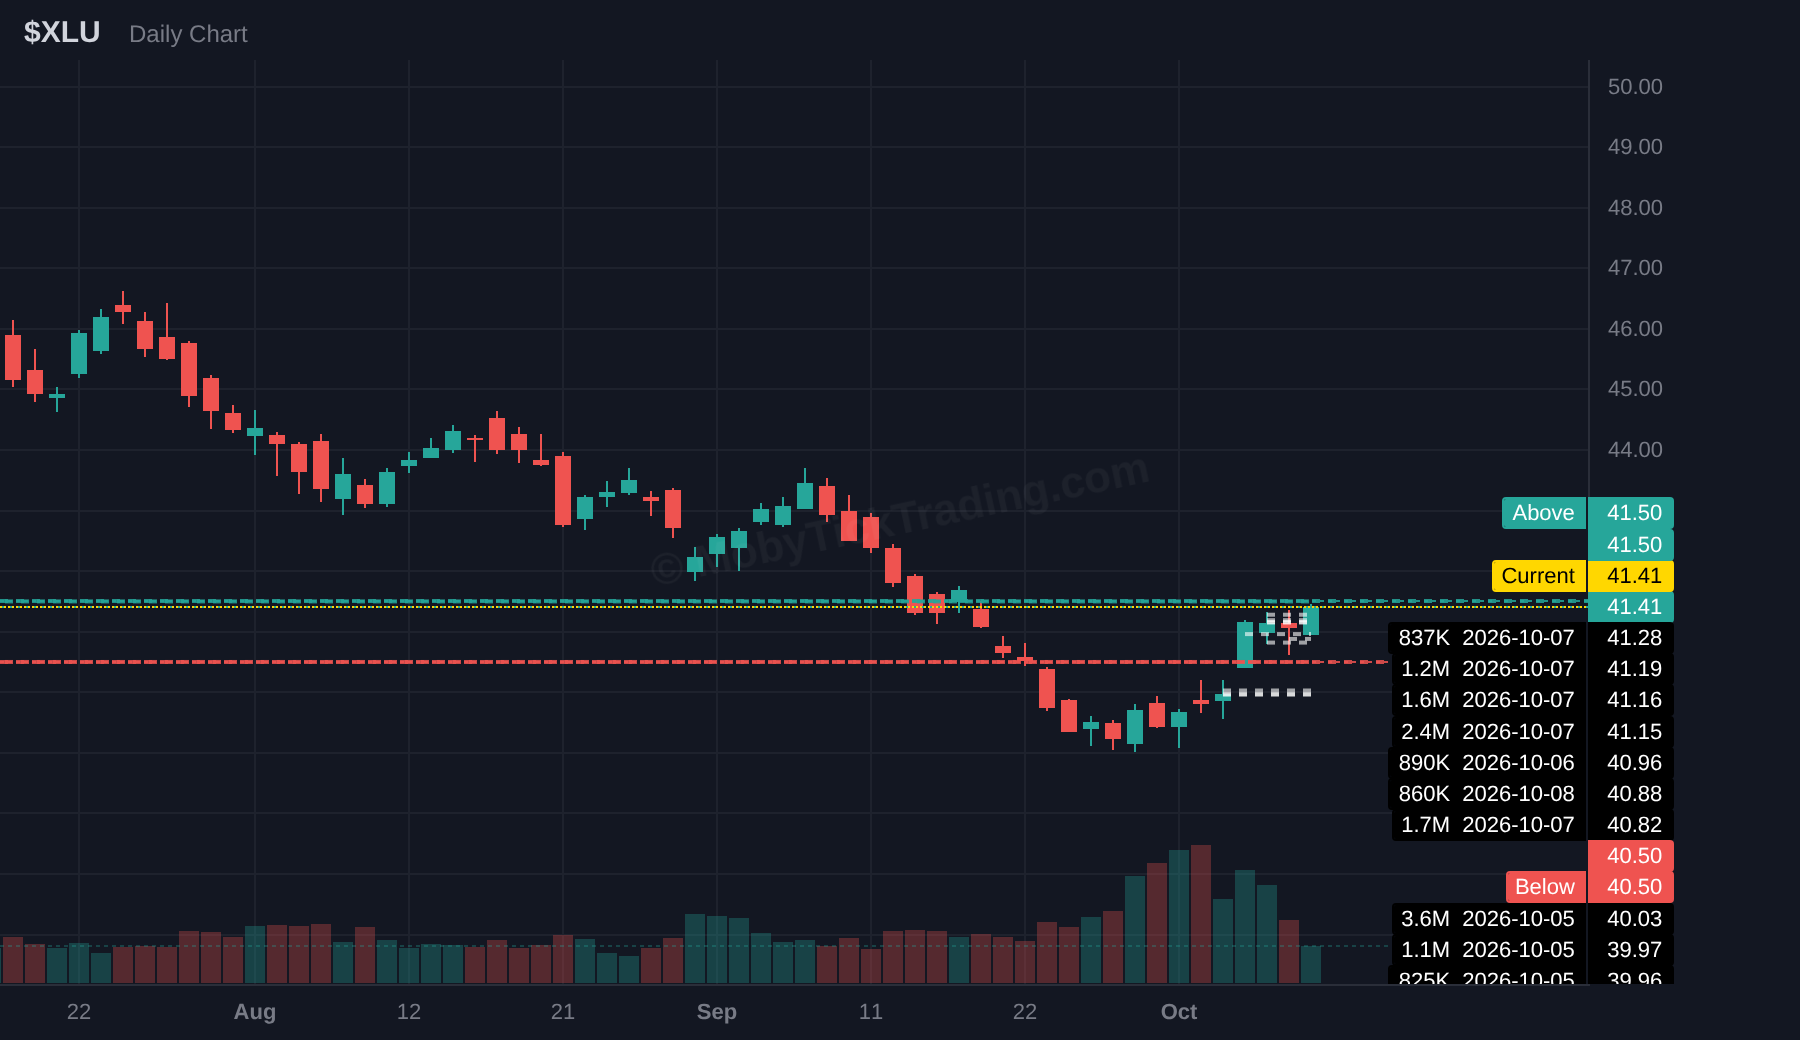
| XLU | $41.5 | $42 → $42.5 → $43 → $43.5 → $44 → $44.5 → $45 |
Bearish Setups — Below Trigger
| Ticker | Below Trigger | Targets |
|---|---|---|
| SPY | $772.00 | $770.00 → $765.00 → $760.00 → $755.00 |
| QQQ | $747.00 | $745.00 → $740.00 → $735.00 → $730.00 → $725.00 → $720.00 |
| IWM | $275.00 | $272.50 → $270.00 → $267.50 → $265.00 → $262.50 → $260.00 |
| MDT | $85.00 | $84.00 → $82.50 → $80.00 → $77.50 → $75.00 |
| NVDA | $225 | $222.50 → $220 → $217.5 → $215 |
| PLTR | $185 | $182.5 → $180 → $177.5 → $175 → $172.5 → $170 |
| TSLA | $367.5 | $365 → $363 → $360 → $355 → $352.5 → $350 |
| WMT | $106 | $105 → $104.26 → $104 → $102.5 → $100 |
| MRNA | $182.5 | $175 → $165 → $150 |
| AMZN | $250 | $247.50 → $245 → $242.5 → $240 → $235 |
| MSFT | $516 | $510 → $515 → $500 → $498 → $495 → $490 |
| PBR | $23.75 | $23 → $22.5 → $22 → $21.57 → $21 |
| XLU | $40.5 | $40 → $39.62 → $39 → $38 → $37.5 → $37 |
This Week’s Setups — Ticker Detail
Each card below shows the dark pool flow data for the past week, along with the key trigger levels and profit targets for the upcoming week. Dark pool stats are sourced from MobyTick’s proprietary analytics.
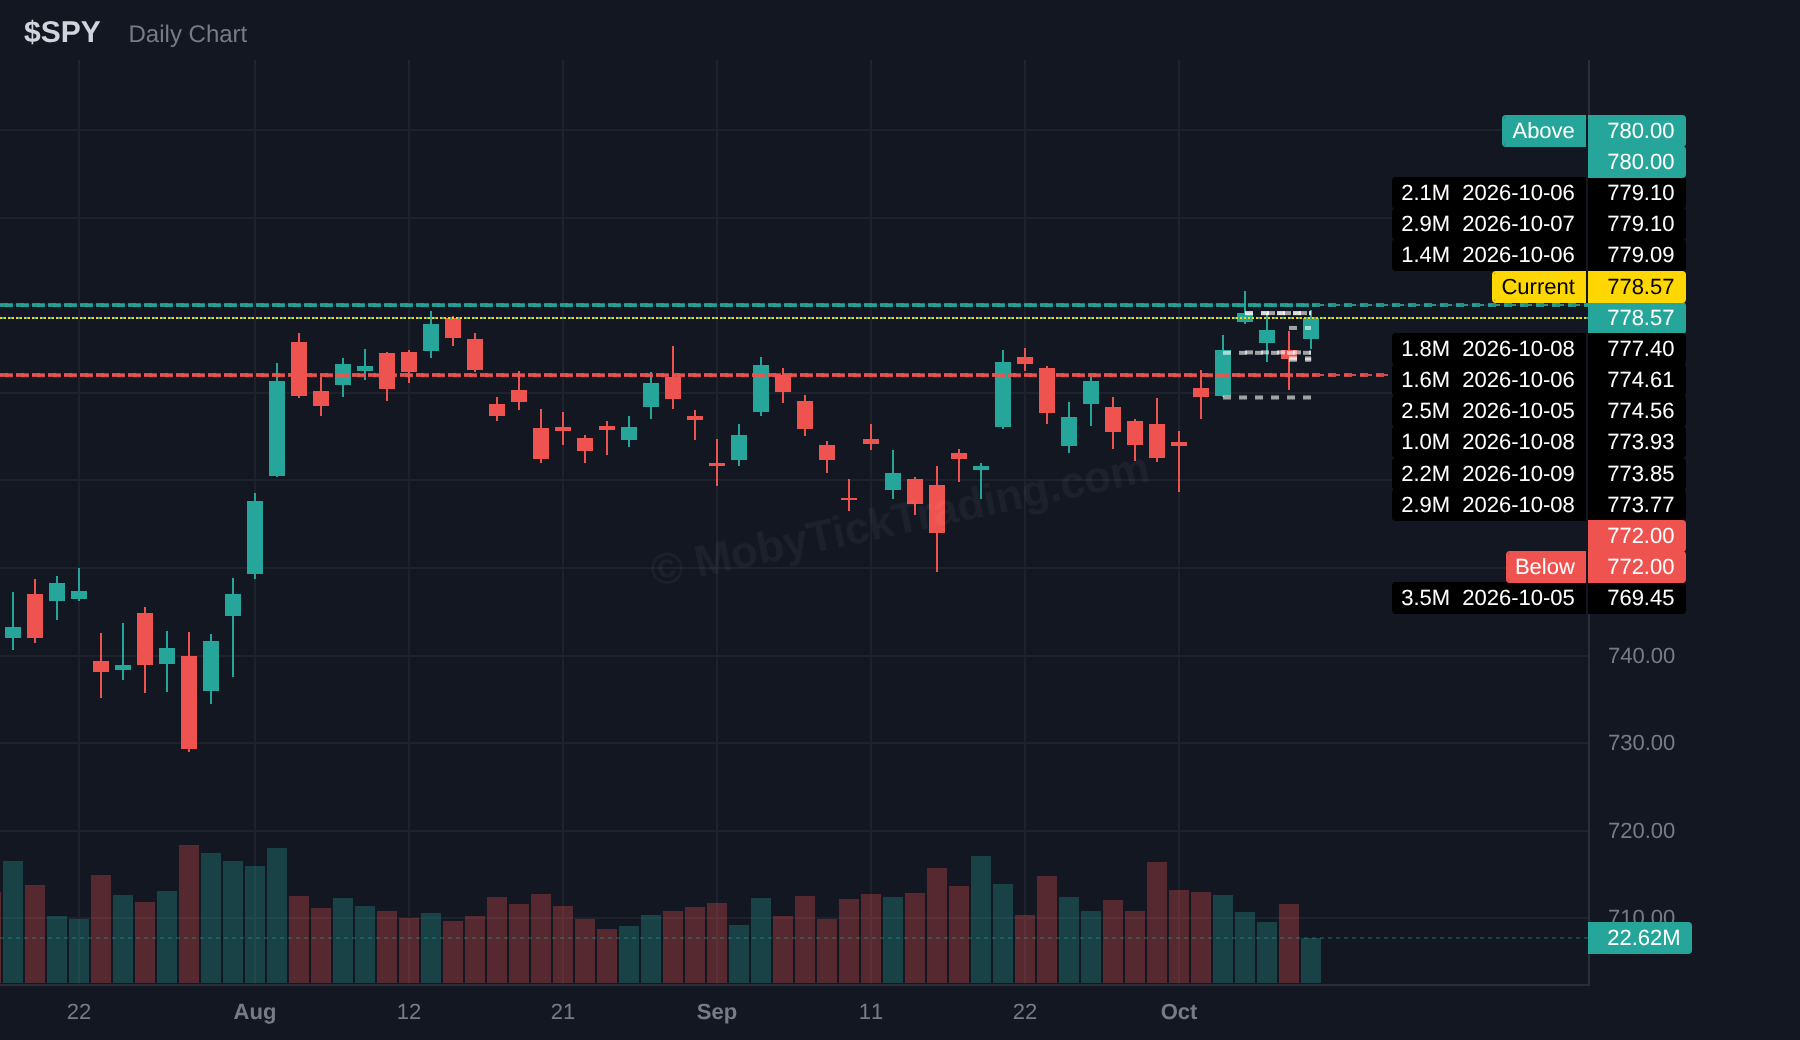
SPY
Above $780.00 → $782.50 → $785.00 → $790.00 → $795.00 → $800.00
Below $772.00 → $770.00 → $765.00 → $760.00 → $755.00
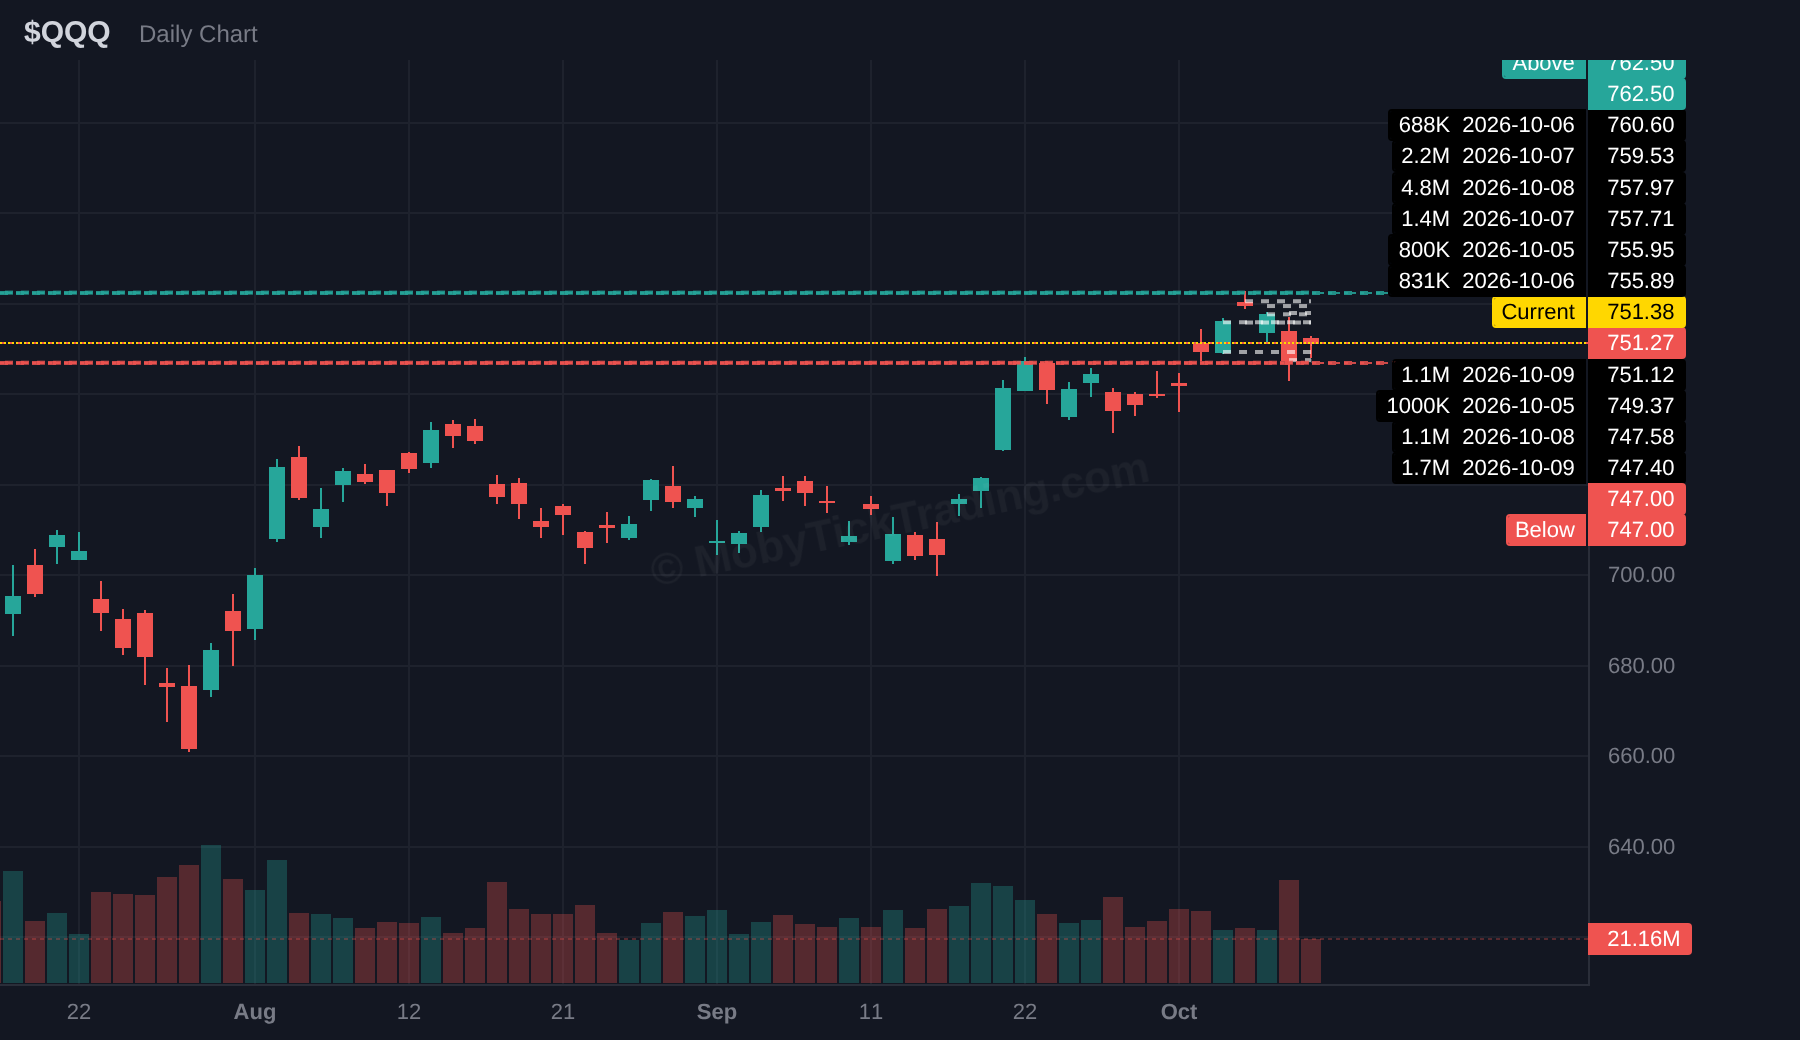
QQQ
Above $762.50 → $765.00 → $770.00 → $775.00 → $780.00 → $785.00 → $800.00
Below $747.00 → $745.00 → $740.00 → $735.00 → $730.00 → $725.00 → $720.00
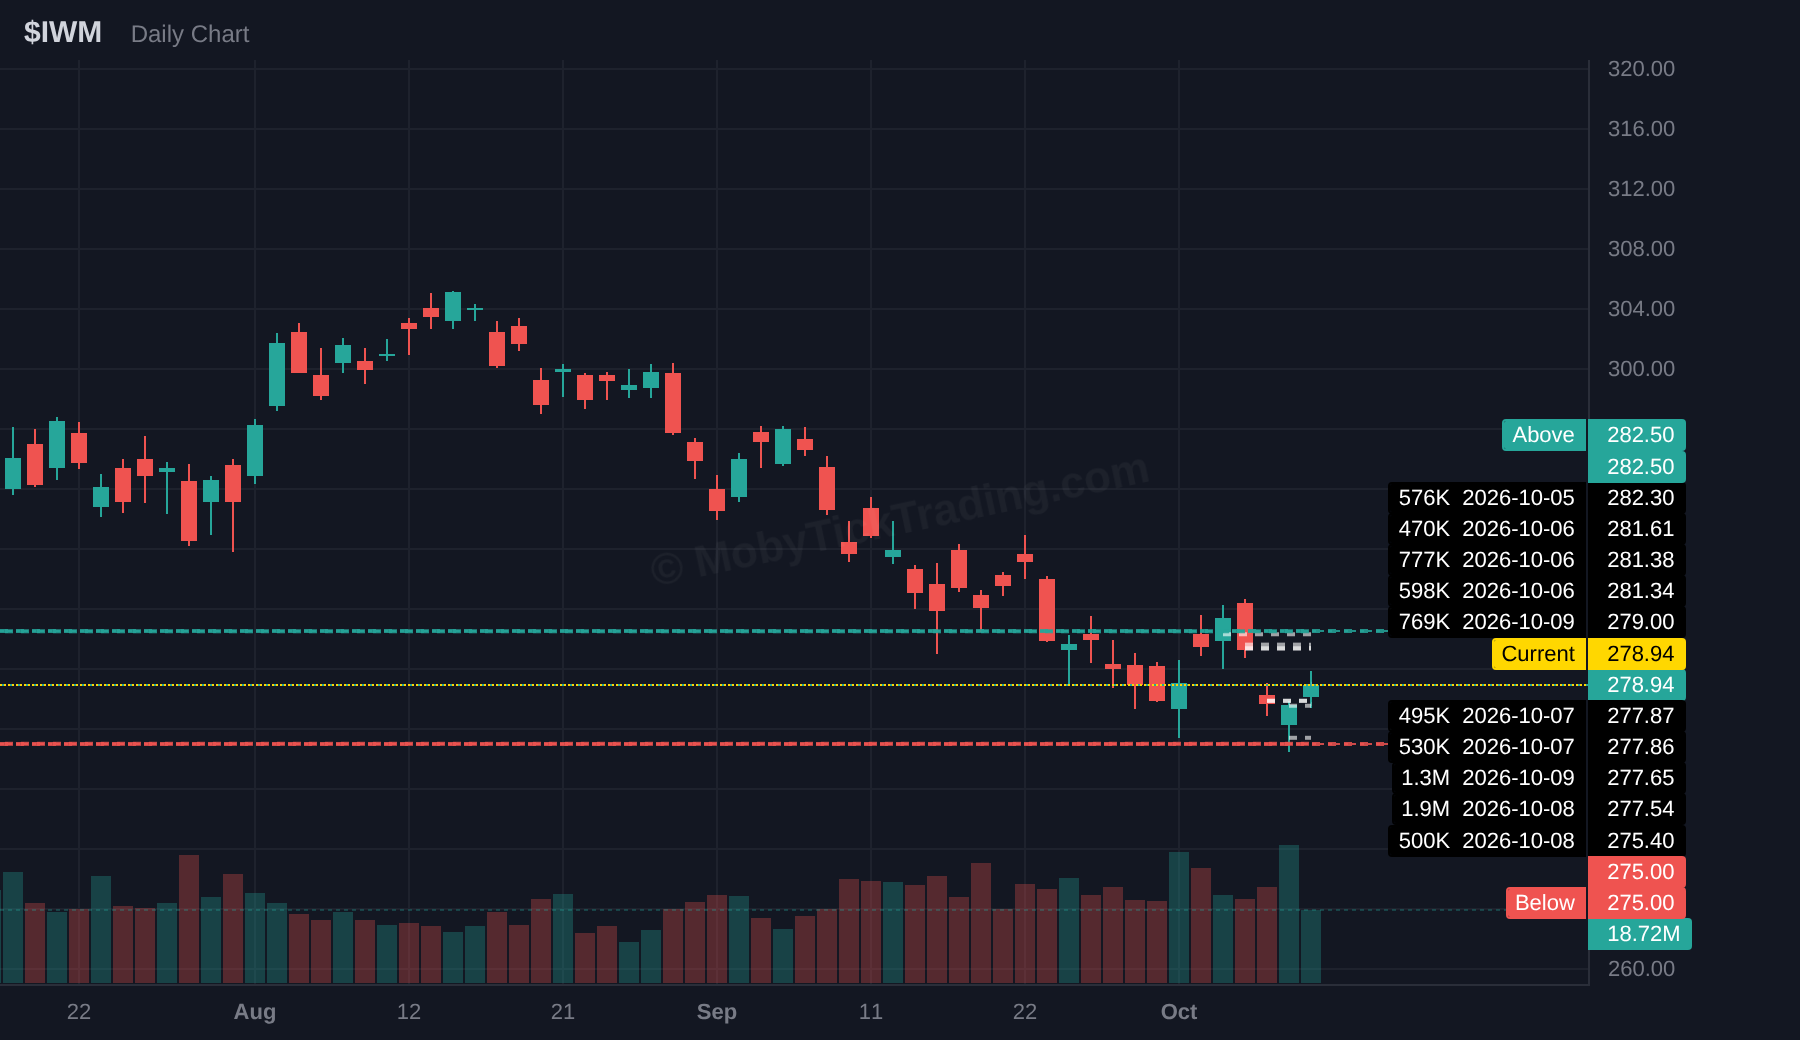
IWM
Above $282.50 → $284.00 → $285.00 → $287.50 → $290.00
Below $275.00 → $272.50 → $270.00 → $267.50 → $265.00 → $262.50 → $260.00
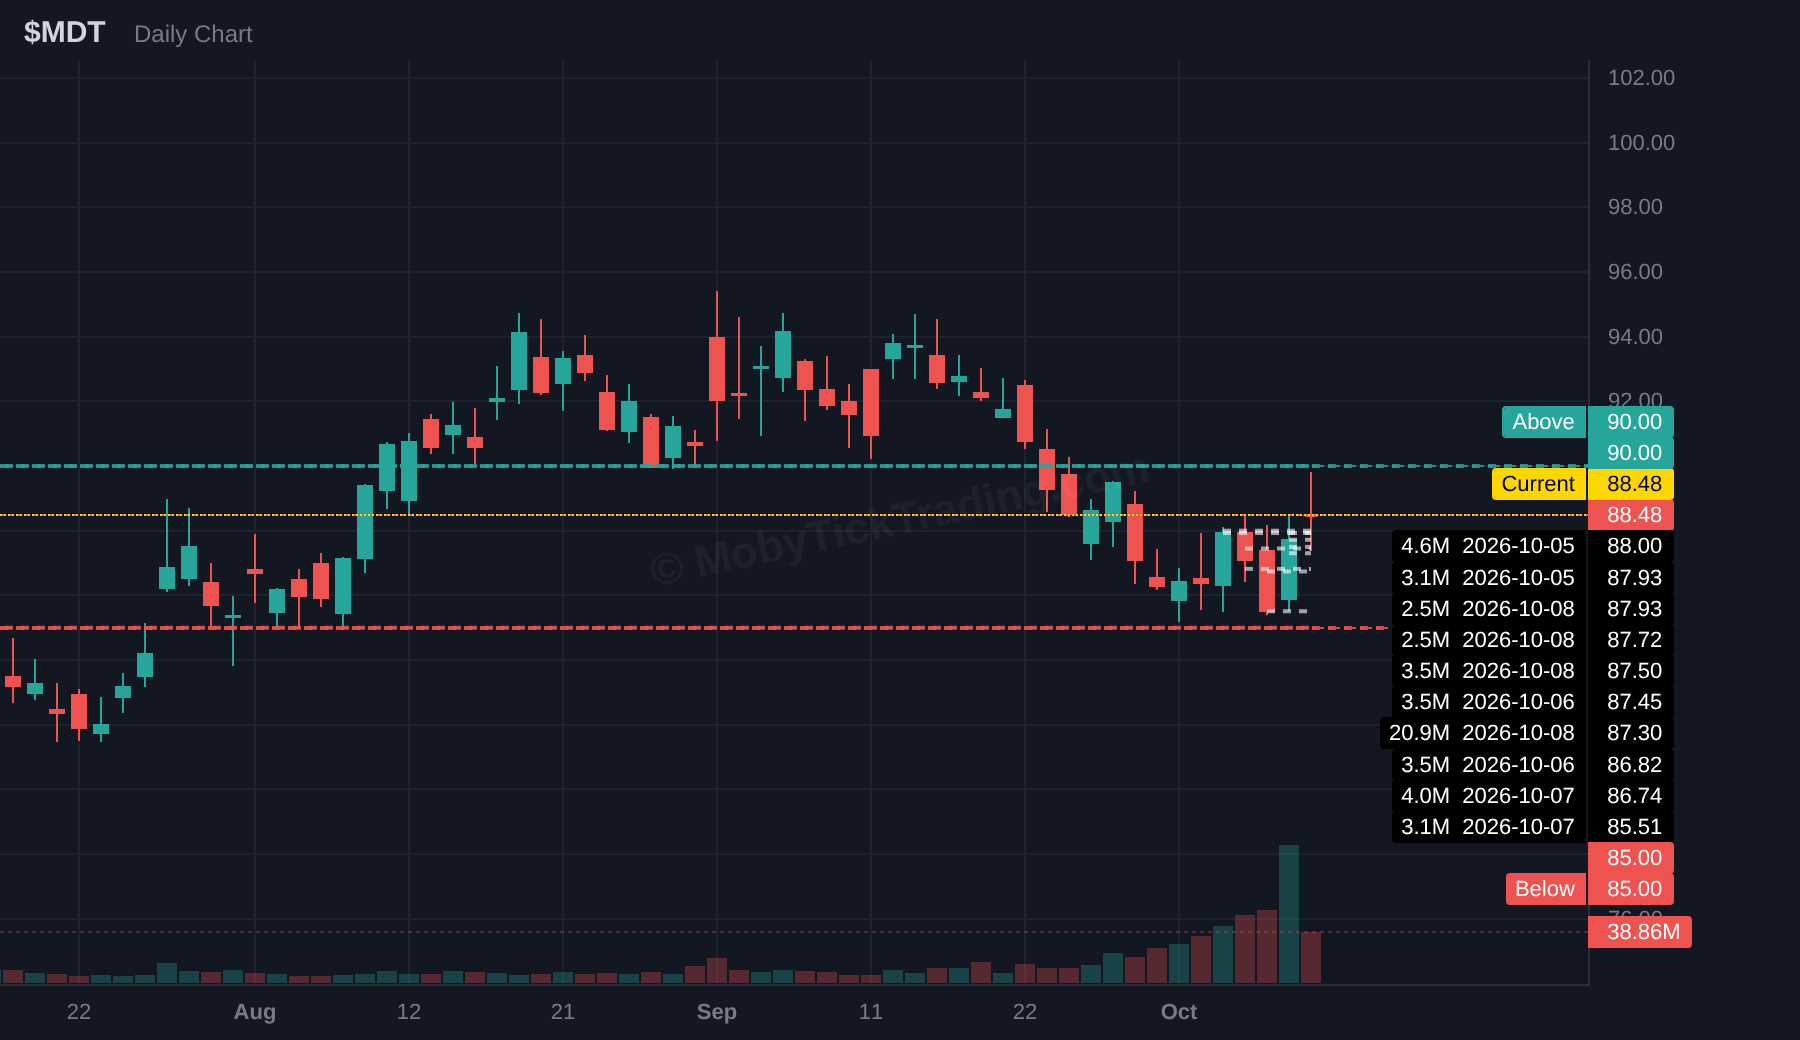
MDT
Above $90.00 → $91.00 → $92.50 → $94.00 → $95.00
Below $85.00 → $84.00 → $82.50 → $80.00 → $77.50 → $75.00
NVDA
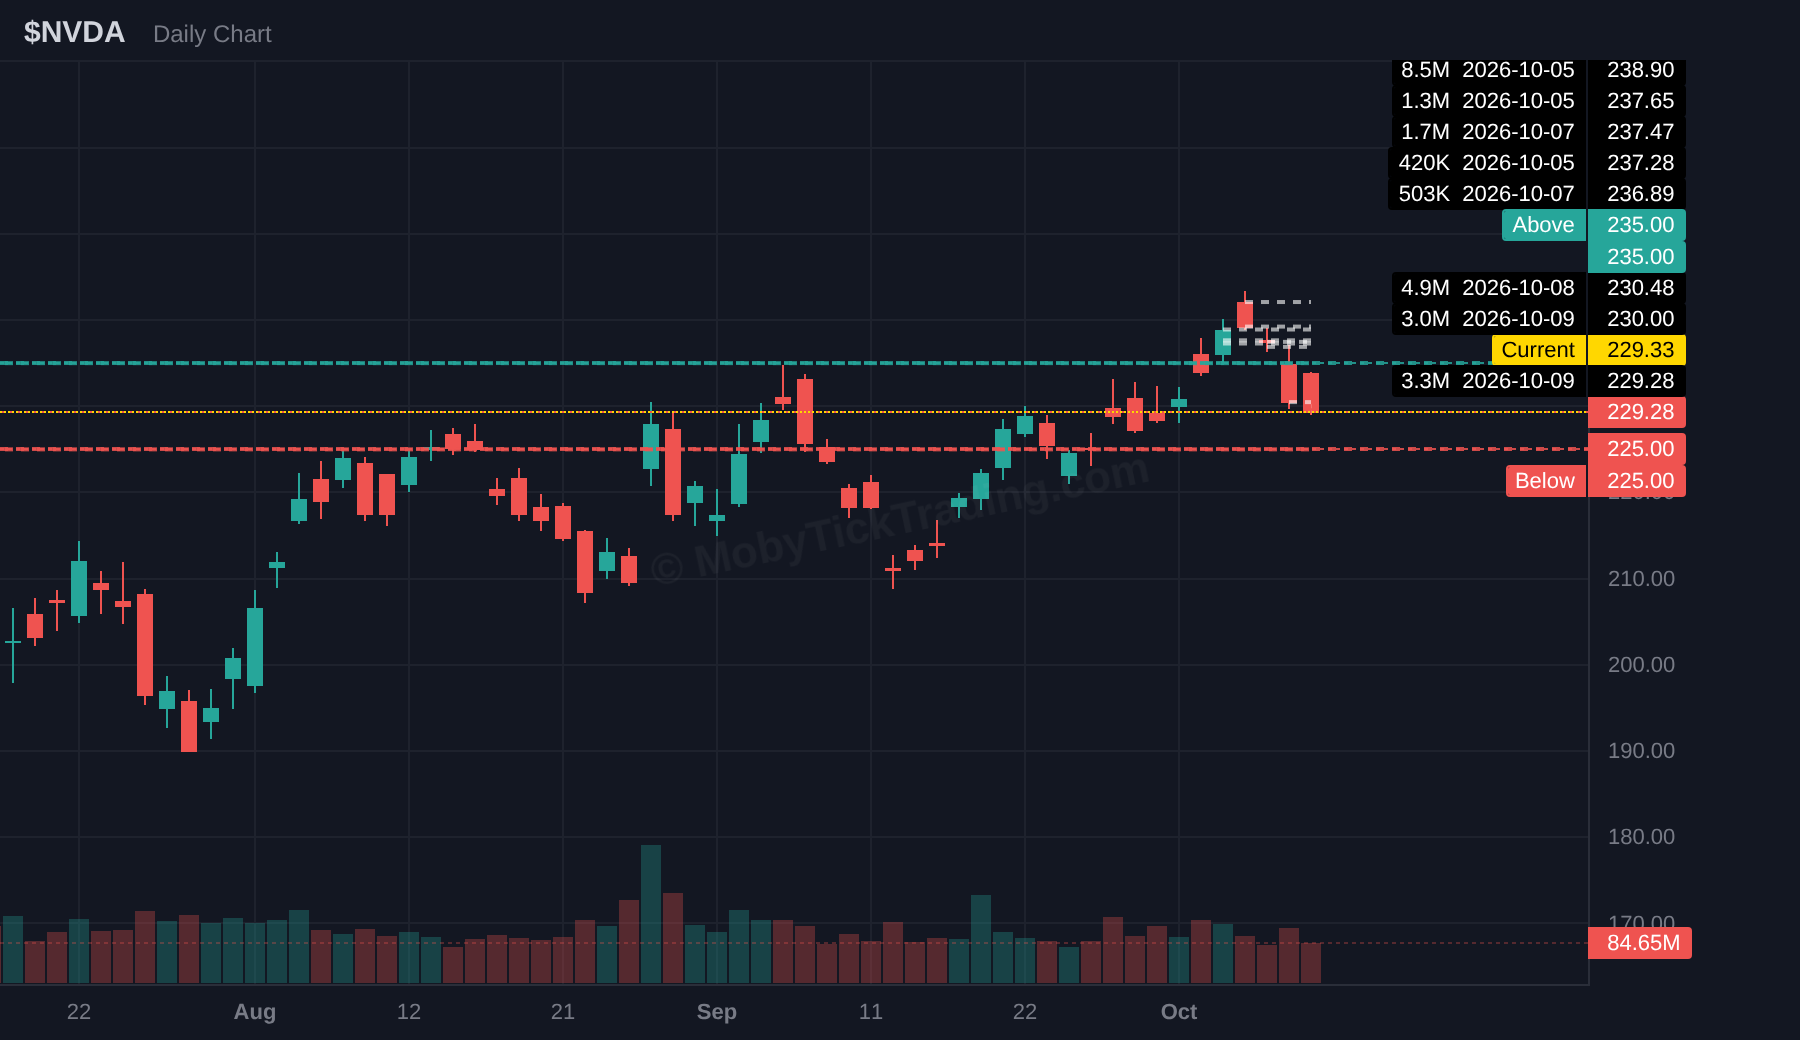
Above $235 → $237.5 → $239.25 → $240 → $242.5 → $245 → $247.5 → $250
Below $225 → $222.50 → $220 → $217.5 → $215
PLTR
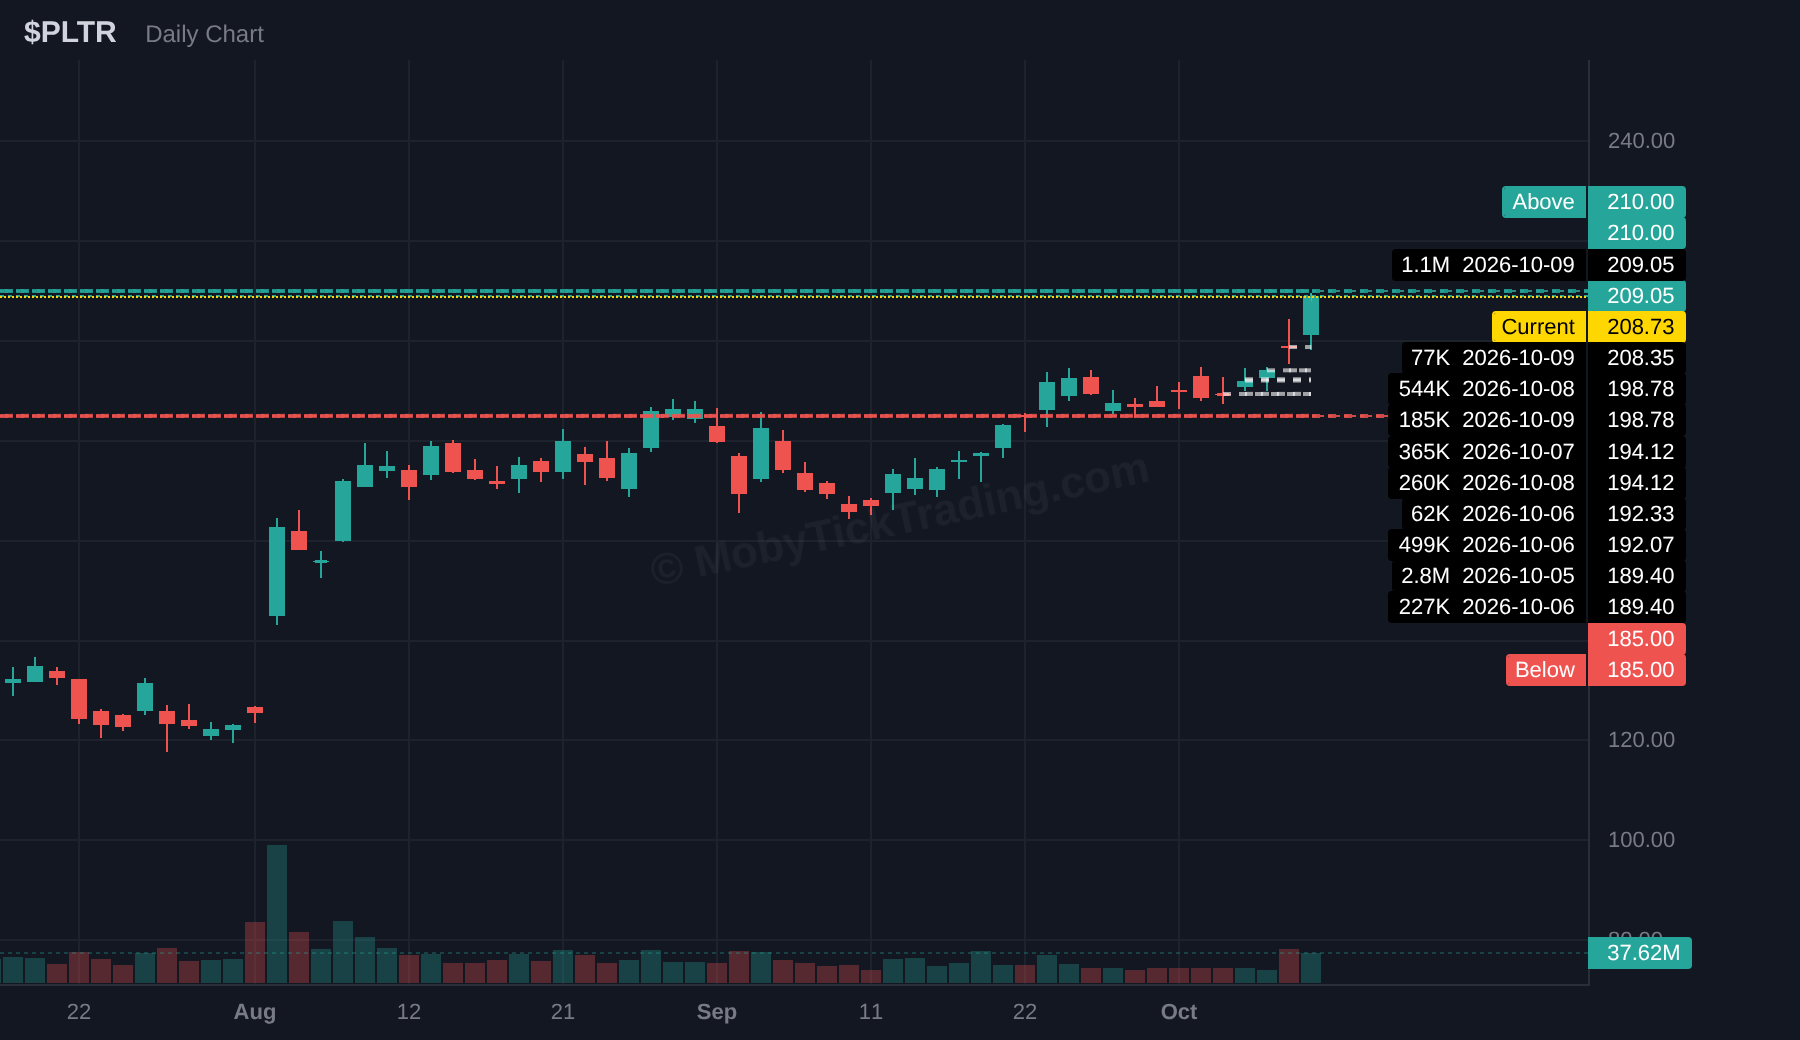
Above $210 → $212.5 → $215 → $217.5 → $220 → $225 → $230
Below $185 → $182.5 → $180 → $177.5 → $175 → $172.5 → $170
TSLA
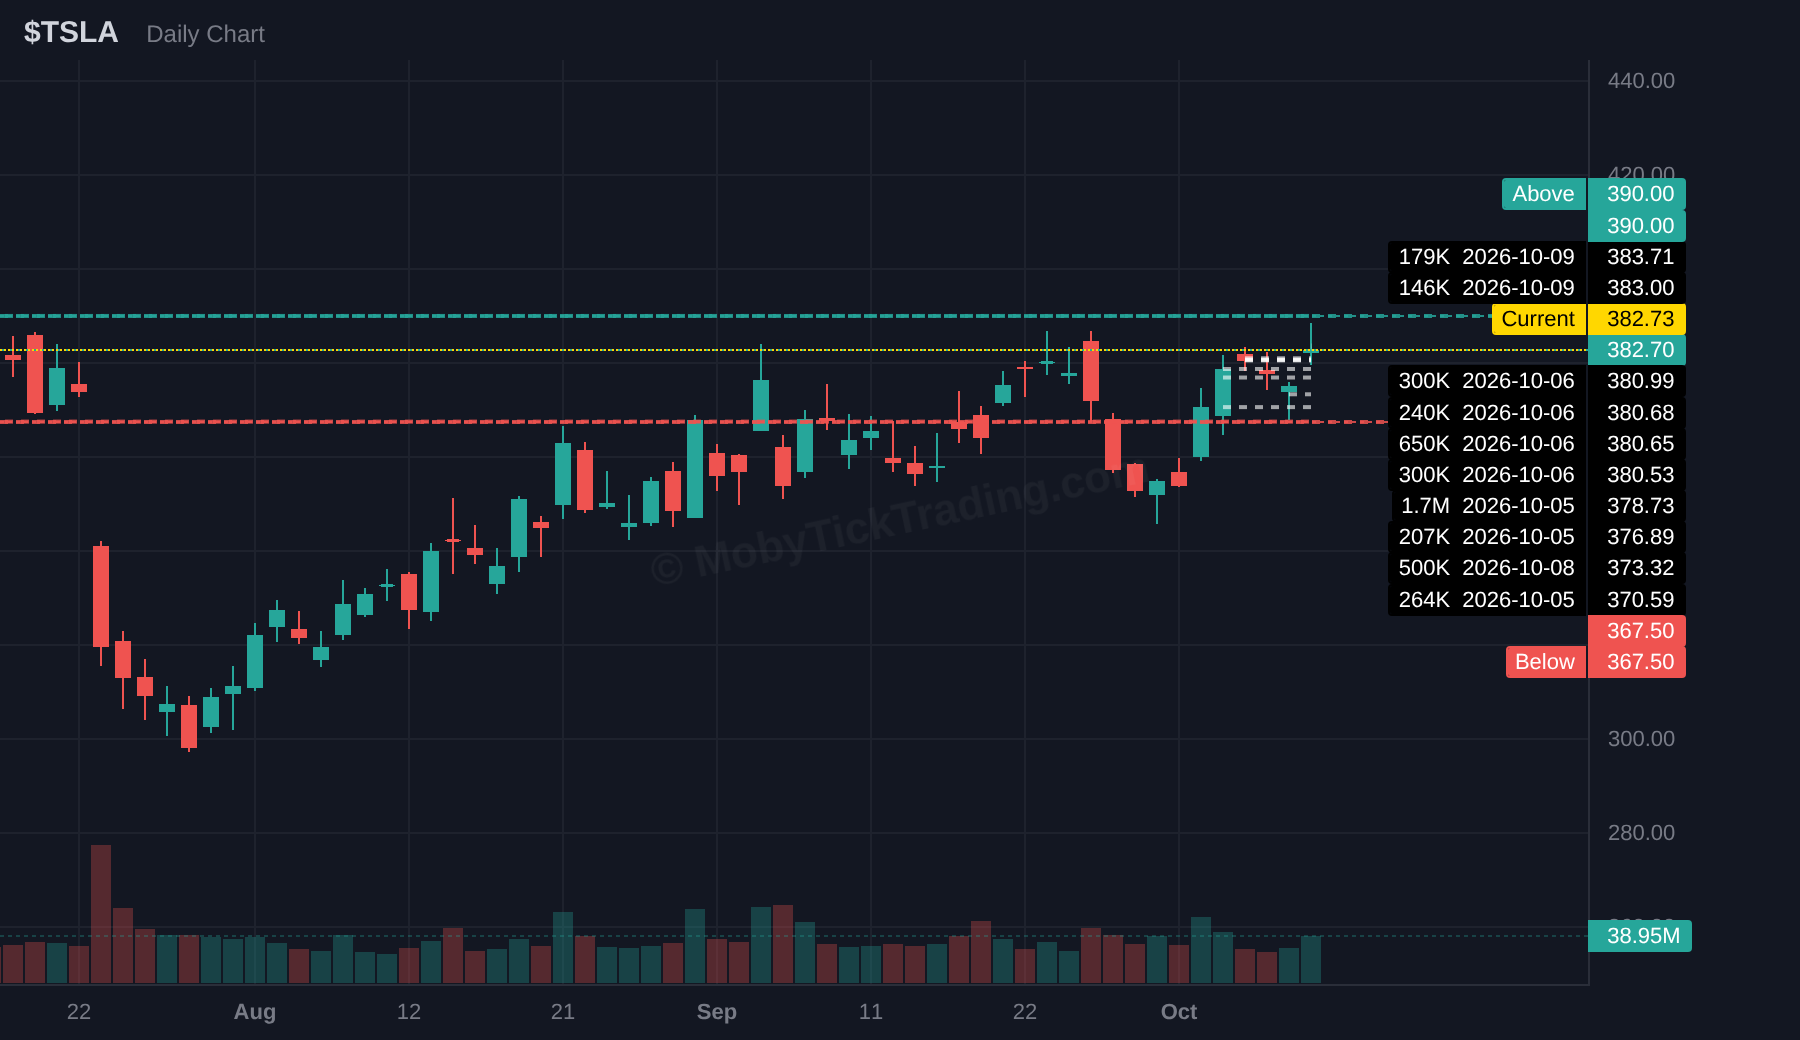
Above $390 → $392.5 → $395 → $400 → $402.5 → $405
Below $367.5 → $365 → $363 → $360 → $355 → $352.5 → $350
WMT
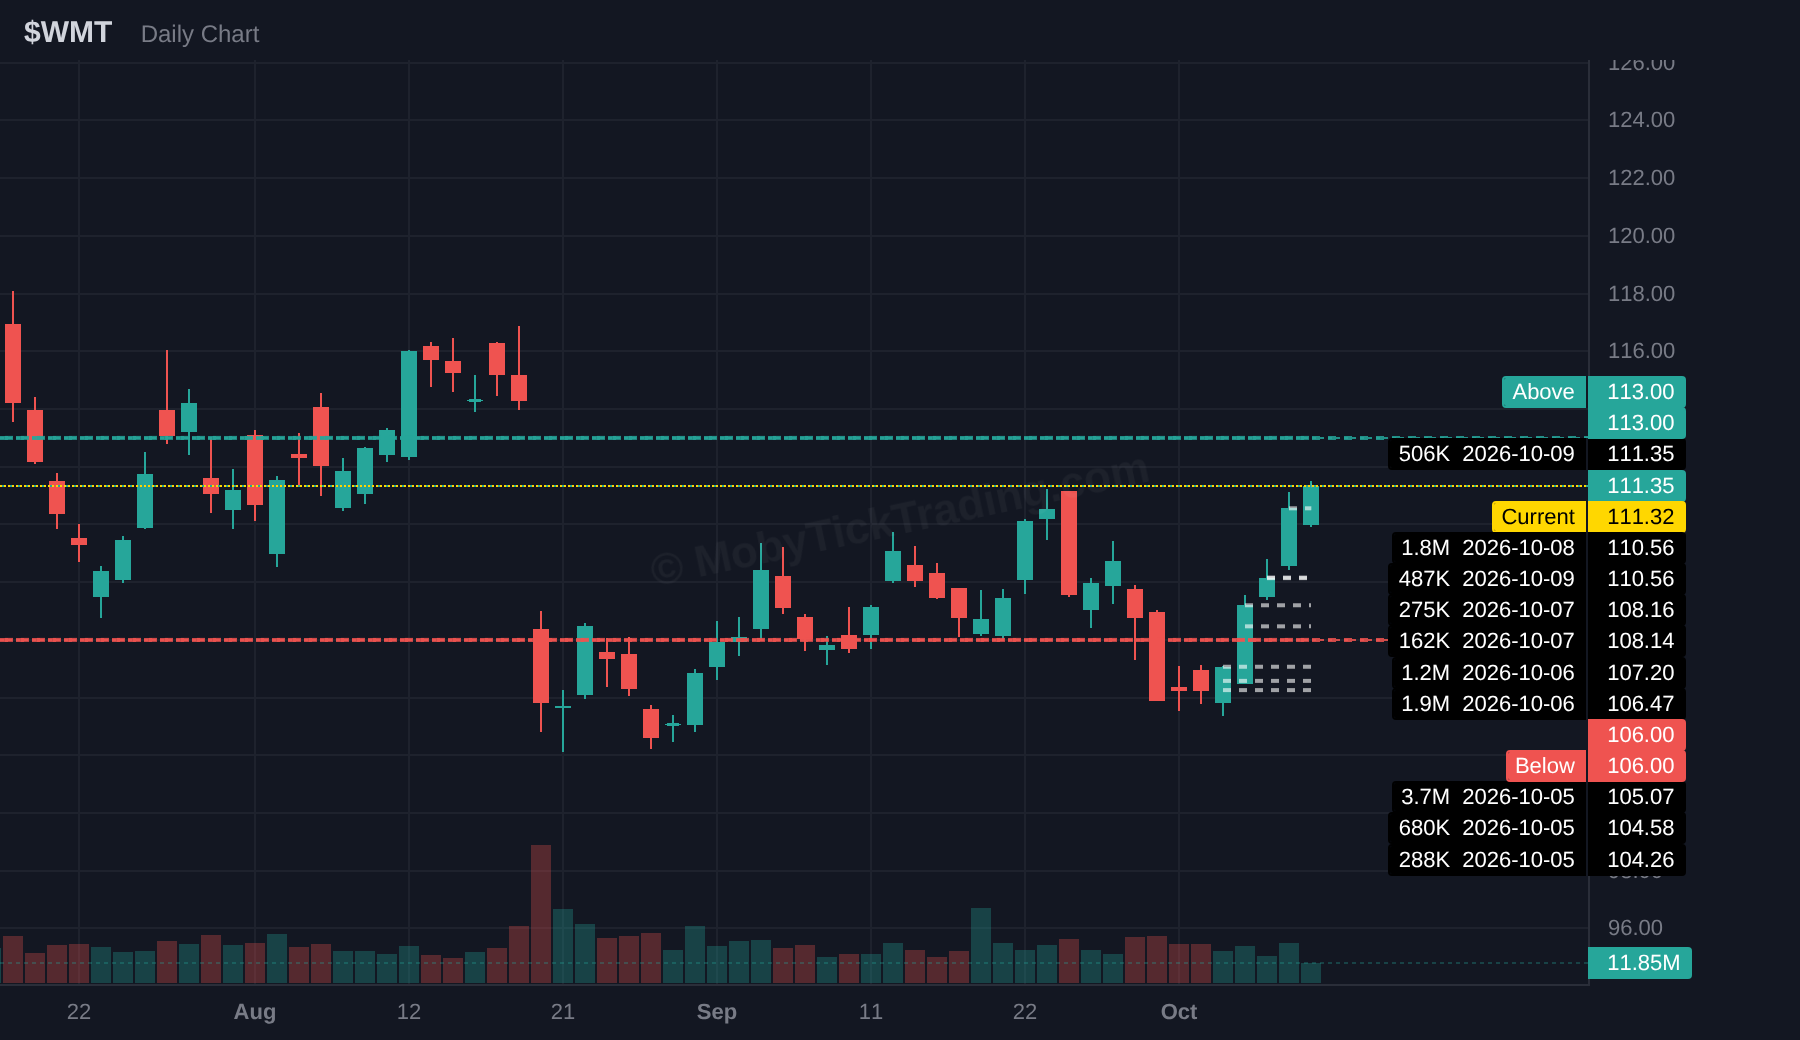
Above $113 → $114 → $115 → $117.5 → $120
Below $106 → $105 → $104.26 → $104 → $102.5 → $100
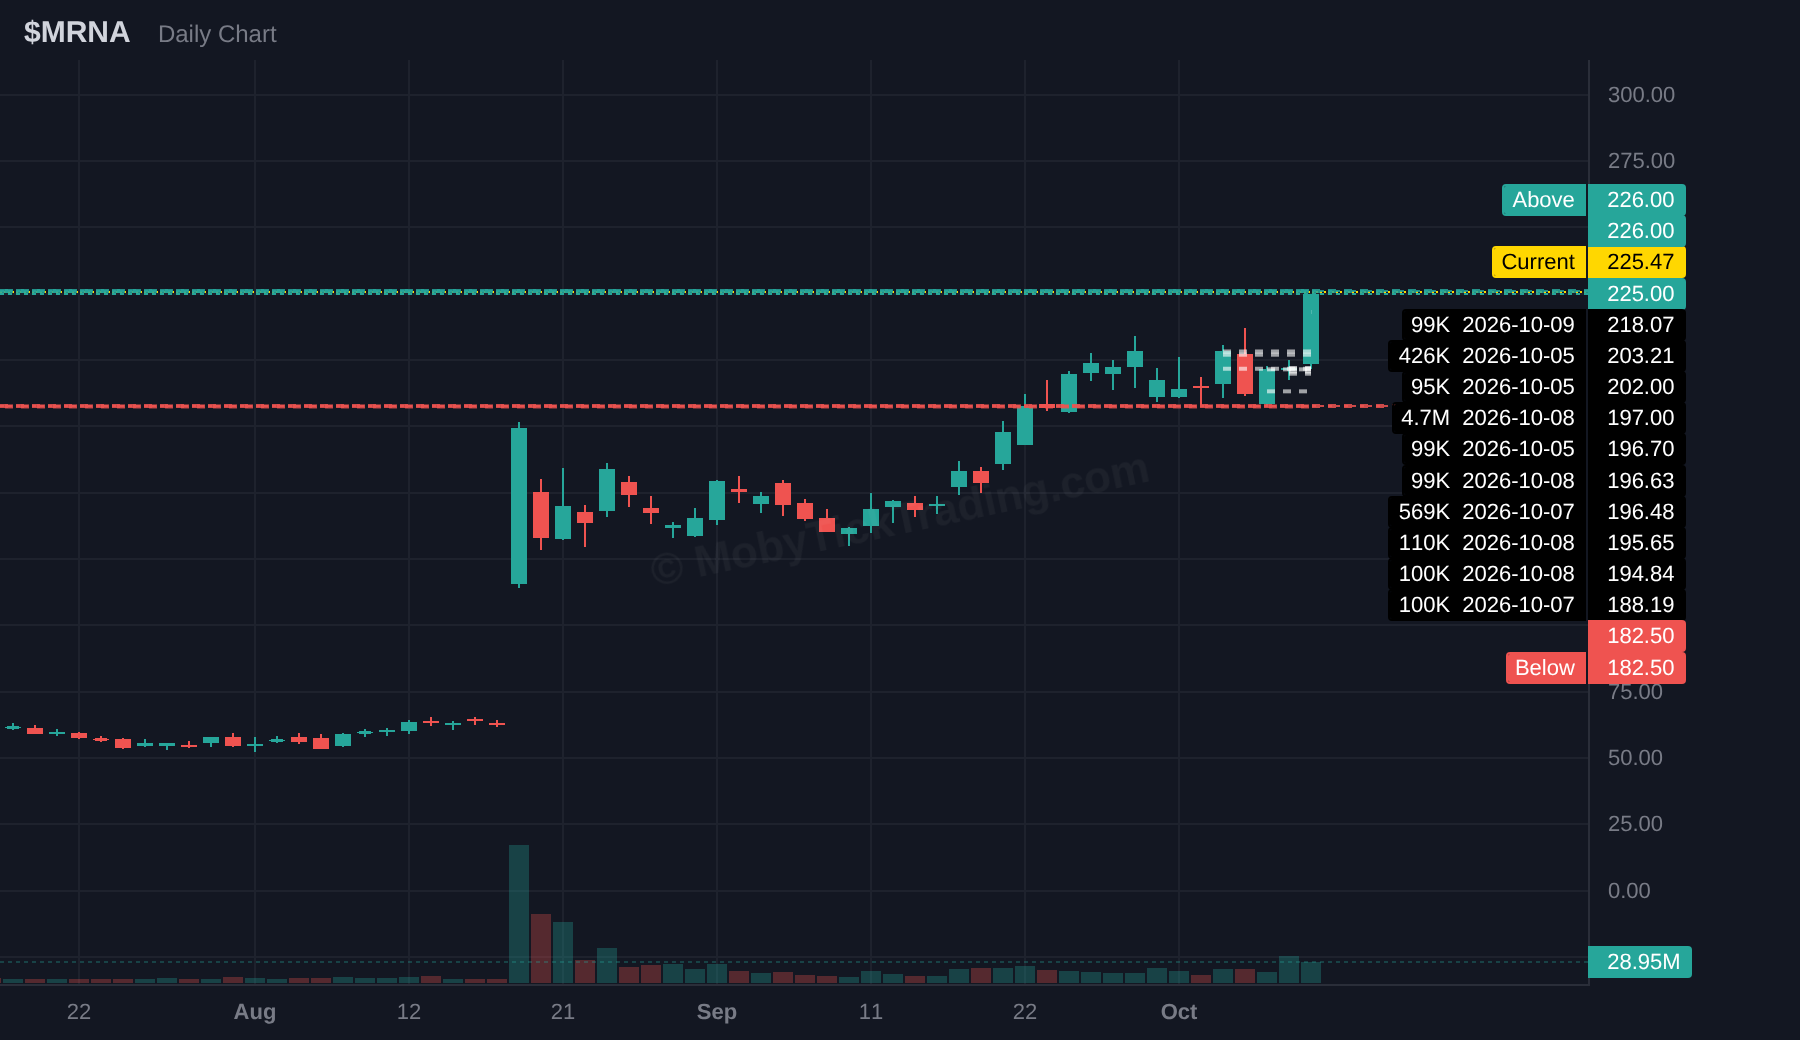
MRNA
Above $226 → $230 → $235 → $240 → $245 → $250 → $255 → $260
Below $182.5 → $175 → $165 → $150
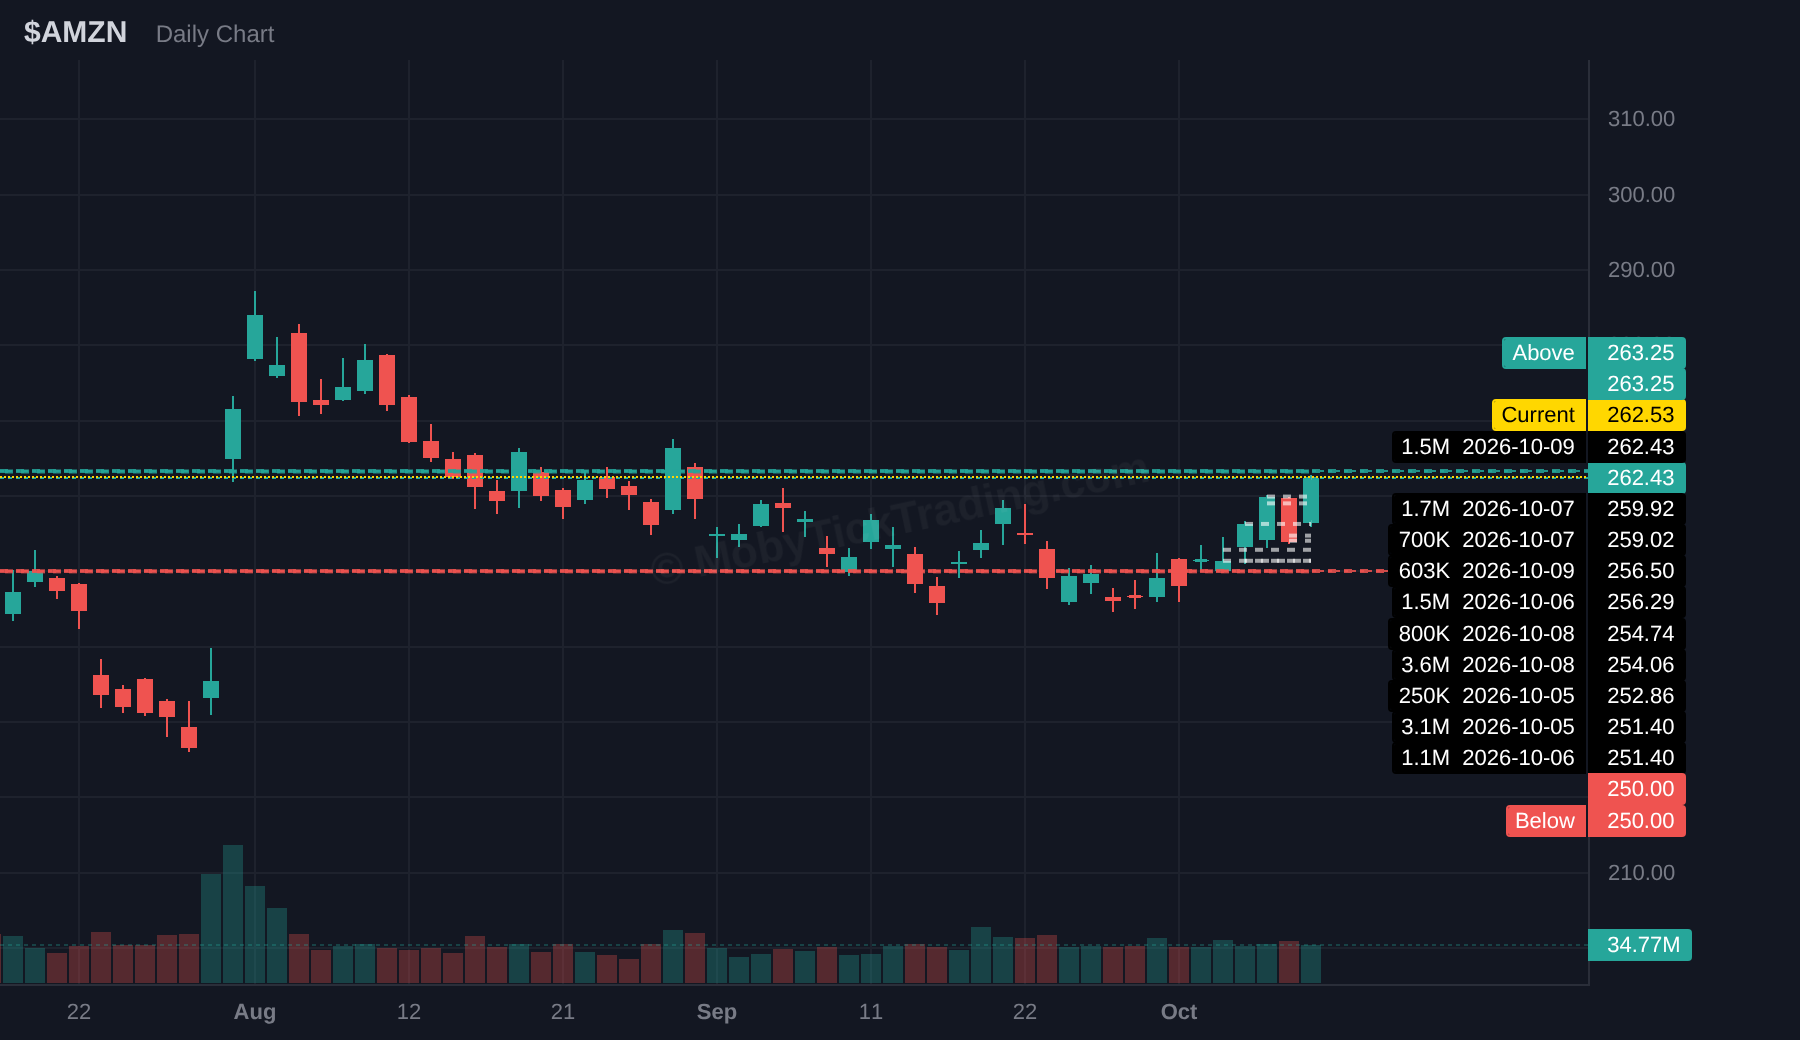
AMZN
Above $263.25 → $265 → $270 → $272.5 → $275 → $280
Below $250 → $247.50 → $245 → $242.5 → $240 → $235
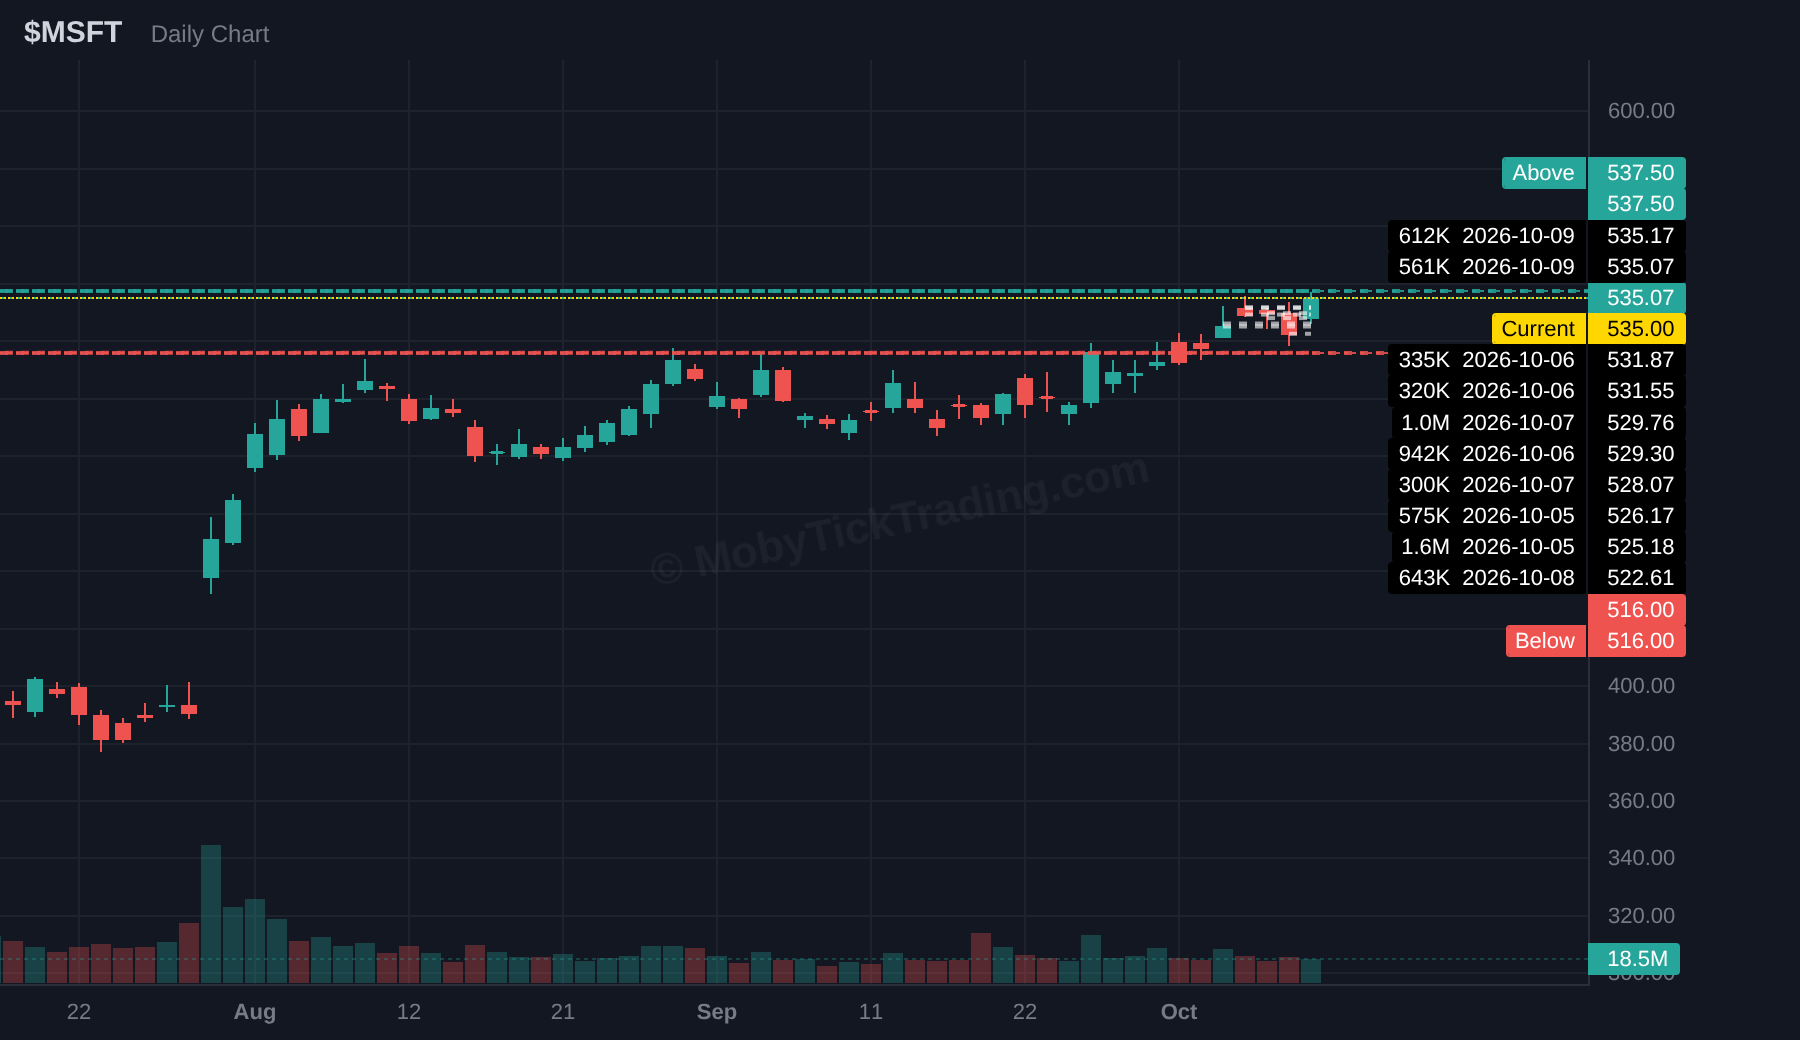
MSFT
Above $537.5 → $540 → $545 → $550 → $555 → $560
Below $516 → $510 → $515 → $500 → $498 → $495 → $490
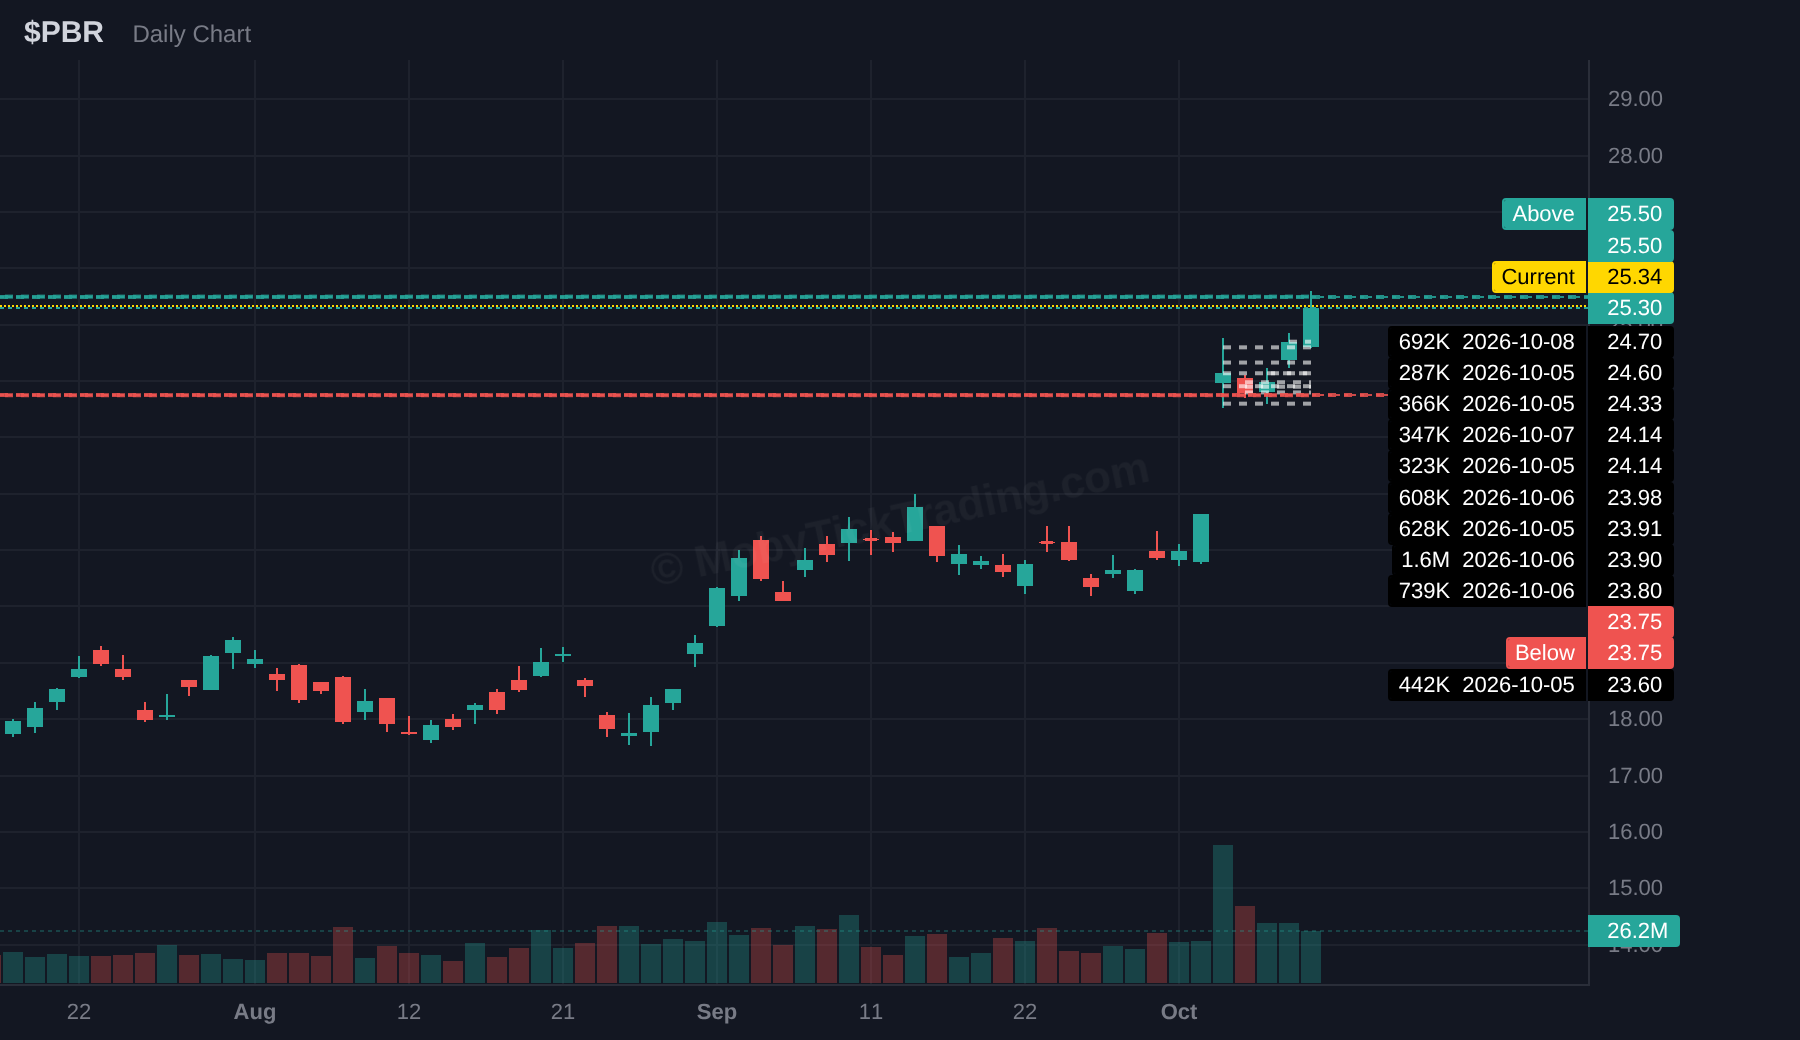
PBR
Above $25.5 → $26 → $26.5 → $27 → $27.5 → $28 → $29 → $30
Below $23.75 → $23 → $22.5 → $22 → $21.57 → $21
XLU
Above $41.5 → $42 → $42.5 → $43 → $43.5 → $44 → $44.5 → $45
Below $40.5 → $40 → $39.62 → $39 → $38 → $37.5 → $37
ETF Dark Pool Flow
For the week of Mon Oct 5 to Fri Oct 9, 2026, MobyTick dark pool data put $61.71B through the broad-market and sector ETF basket, with the two index majors doing most of the work. SPY and QQQ alone accounted for $46.14B.
Broad-Market ETFs
| ETF | Notional | Shares | Levels |
|---|---|---|---|
| SPY | $24.61B | 31.73M | 49 |
| QQQ | $21.53B | 28.52M | 90 |
| IWM | $4.22B | 15.10M | 60 |
| IVV | $3.08B | 3.95M | 21 |
| VOO | $1.19B | 1.67M | 9 |
| DIA | $0.16B | 0.30M | 4 |
SPY led with $24.61B on 31.73M shares across 49 levels, 0.740× its 30-day average volume. QQQ printed $21.53B on 28.52M shares and logged 90 levels, the most of any ETF this week, at 0.872× ADV. The five broad-market ETFs together carried $54.63B. IWM came in at $4.22B on 15.10M shares and 60 levels, 0.636× ADV, its notional about a sixth of SPY’s. IVV added $3.08B and VOO $1.19B.
SPY gained 1.15% on the week, QQQ 0.26%, and IWM fell 1.07%.
| Session | Notional | Shares |
|---|---|---|
| Mon Oct 5 | $14.28B | 38.52M |
| Tue Oct 6 | $10.53B | 26.07M |
| Wed Oct 7 | $13.14B | 40.00M |
| Thu Oct 8 | $15.72B | 39.84M |
| Fri Oct 9 | $8.04B | 23.25M |
The basket was heaviest on Thursday Oct 8 at $15.72B and lightest on Friday Oct 9 at $8.04B, roughly half the Thursday figure. The middle three sessions clustered between $10.53B and $15.72B.
Sector Rotation
| ETF | Sector | Notional | Shares | Levels | Week % |
|---|---|---|---|---|---|
| XLF | Financials | $1.37B | 25.43M | 67 | +2.30% |
| XLE | Energy | $0.90B | 14.00M | 52 | +3.72% |
| XLU | Utilities | $0.82B | 20.06M | 56 | +3.88% |
| GLD | Gold | $0.80B | 2.10M | 16 | +1.02% |
| SMH | Semiconductors | $0.70B | 1.14M | 9 | −4.46% |
| XLV | Health Care | $0.41B | 2.42M | 8 | +2.90% |
| XLY | Consumer Discretionary | $0.38B | 3.39M | 12 | +2.81% |
| XLI | Industrials | $0.24B | 1.40M | 9 | −0.23% |
| XBI | Biotech | $0.22B | 1.49M | 7 | −1.15% |
| XLC | Communication Services | $0.21B | 1.91M | 7 | +0.15% |
| XLB | Materials | $0.20B | 4.09M | 10 | +1.23% |
| XLK | Technology | $0.11B | 0.53M | 6 | −0.74% |
| XLRE | Real Estate | $0.06B | 1.52M | 11 | +2.06% |
| XLP | Consumer Staples | $0.05B | 0.65M | 7 | +3.63% |
Utilities, energy and staples led the week on price, at plus 3.88%, plus 3.72% and plus 3.63%. Four sector funds finished lower: SMH fell 4.46%, XBI 1.15%, XLK 0.74% and XLI 0.23%. That is a full reversal from the prior week, when chips and technology led and utilities, energy and staples trailed.
XLF carried the most dark pool notional of any sector ETF at $1.37B on 25.43M shares and 67 levels, about 1.5 times second-place XLE. XLU ranked third by notional at $0.82B but second by shares at 20.06M, and its 0.662× ADV ratio was the highest among the sector funds. XLE sat between them at $0.90B on 14.00M shares and 52 levels. XLP, the third-best performer on price at plus 3.63%, printed the smallest notional of the group at $0.05B.
Further down the table, price and notional did not line up. SMH had the largest move of any sector ETF at minus 4.46% and printed $0.70B across only 9 levels, the fifth-largest notional in the group. XLB logged 10 levels on $0.20B, a higher count than XLV, XLC, XLK, XBI or XLP. XLK, the third-weakest on price, printed $0.11B, the second-smallest reading. GLD matched XLU’s $0.82B closely at $0.80B but on 2.10M shares and 16 levels.
*Data: MobyTick dark pool prints and pricing, Oct 5 to Oct 9, 2026. Prints at the exact daily closing price are excluded. Weekly % runs Monday open to Friday close.*
The Splash
A $1.26 Billion Print. Then Price Dropped 22%. Here’s Why That Wasn’t a Mistake.
The Mistake Almost Every New Dark Pool Trader Makes
A huge print hits the tape. Institutional money just moved, so you buy. Then the stock drops for three days… and keeps dropping. You sell at a loss and decide dark pool data “doesn’t work.”
The data was fine. The timing was the problem.
At MobyTick we call this the splash. When a large print comes in, price often moves in the *opposite* direction first, before the real move begins. Think of a whale hitting the water: the splash comes before the swim.
Why does it happen? An institution rarely builds or unloads a position in a single trade. After a big print, they are often still adjusting. They may be selling more into a rally ahead of a bigger move down, or letting price bottom out while they keep accumulating before a larger move up. Either way, the first move after the print is usually noise, not the signal.
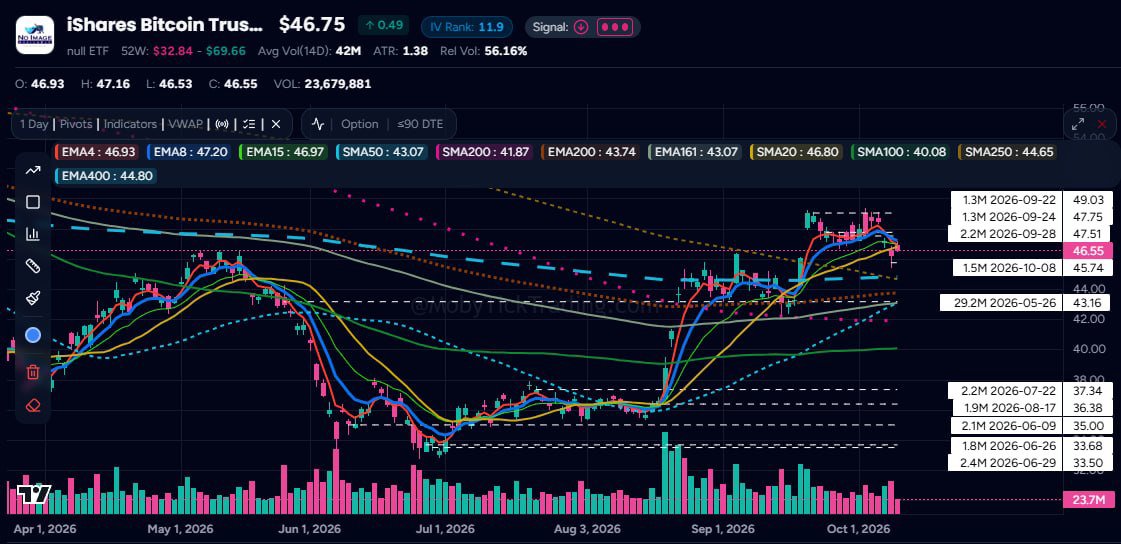
This week, IBIT (iShares Bitcoin Trust) gives us one of the cleanest examples of the full cycle we’ve seen: the print, the splash, the accumulation, and the reclaim, all on one chart.
The Chart
Step 1: The Anchor Print
On May 26, a single print of 29.2 million shares went through at $43.16. That’s roughly $1.26 billion in one trade.
Look at the right side of the chart. Every other print on it is under 2.5 million shares. This one is more than ten times larger than anything else on the chart, and it’s about 70% of IBIT’s recent average daily volume in a single print. That makes it the anchor: the most important level on this chart. Remember, it’s the size of the print that matters, not how many trades there are.
If you bought IBIT that day because “a whale just bought,” here’s what happened next.
Step 2: The Splash
Price did not hold $43.16. It fell roughly 22% over the following month, bottoming near $33.50 in late June.
That’s a bigger, longer splash than usual. Most splashes play out over a few days. But the larger the print and the larger the market, the longer the adjustment can take. A billion-dollar position doesn’t get built or unwound overnight.
Step 3: Watch What Happens at the Bottom
While price was falling, new prints kept arriving, and they weren’t random:
| Date | Shares | Price | Value |
|---|---|---|---|
| June 9 | 2.1M | $35.00 | $73.2M |
| June 26 | 1.8M | $33.68 | $60.0M |
| June 29 | 2.4M | $33.50 | $80.4M |
| July 22 | 2.2M | $37.34 | $81.5M |
| August 17 | 1.9M | $36.38 | $69.7M |
Notice where they landed: $35.00 and $33.50. Both sit right on the fractional dollar grid, a whole dollar and a half-dollar level. Institutions still trade in round, behavioral price levels.
While retail traders were giving up on IBIT in June, someone was steadily building a position. Price then went sideways from July into mid-August, building a base above those prints.
Step 4: The Reclaim
In mid-August, IBIT broke out of that base on the biggest volume bars on the entire chart. Price drove straight back through the $43.16 anchor and kept going, then gapped higher in September.
That’s the signal we actually trade: a break above a range of prints on increasing volume, which tells us the institution may be done accumulating. The traders who waited for this got the move. The traders who bought the May print had to sit through a 22% drawdown just to get back to even.
The Real Lesson: Trade the Reaction, Not the Guess
Here’s the part most people miss: we don’t know who was on which side of that May print.
Maybe a buyer took those 29.2 million shares, then averaged down at $33–$35. Maybe it was a seller, and the buyers at the bottom absorbed the supply. Dark pool prints show you *where* big money transacted. They don’t tell you *which direction* it went.
And that’s fine. You don’t need to guess the direction. You watch how price reacts to the level. A print stays relevant as long as price keeps respecting it.
What We’re Watching This Week
IBIT closed Friday at $46.55, pulling back from a shelf of newer prints between $47.51 and $49.03 (September 22 to October 2). We always map a level above and a level below so we stay unbiased.
Bullish above: A move back above $47.51 (2.16M shares, about $102.6M, on Sept 28, sitting right on the $47.50 grid level) on increasing volume would put the $49.03 top of the range back in play.
First support: $45.72–$45.75, where two prints totaling 2.5M shares (about $114M) came in on Oct 8.
The big one: $43.16, the May anchor. It now has serious confluence:
- SMA50 and EMA161 both at $43.07
- EMA200 at $43.74
- SMA200 just below at $41.87
If IBIT pulls back and holds $43.16 from above, that’s a textbook test of prints on the most important level on the chart: the same level that started this whole story in May.
Bearish below: A daily close below $43.16 and the SMA200 at $41.87 would put the summer prints at $37.34 and $36.38 back in focus.
Is it a buy right now? Not on our criteria. Friday’s candle closed below the 4 and 8 EMAs, and volume was light (about 56% of average). That doesn’t make it a short. It means the setup isn’t ready yet. Set your alerts around $45.75 and $43.16 and let price come to you. Waiting for an entry isn’t missing the trade; that’s what alerts are for.
Key Takeaways
- A big print is a level, not a buy signal. Expect the splash before the real move.
- The splash can last days, or weeks. Bigger prints in bigger markets can take longer to play out.
- Watch the prints that arrive during the drop. Accumulation often shows up where everyone else is giving up.
- Enter on the reclaim, not the print: a break above the range of prints on increasing volume.
- You don’t need to know which side the institution was on. Trade the reaction to the level.
One Important Note on IBIT
IBIT tracks the price of bitcoin, so it can move sharply on crypto news regardless of what the prints show. Many large IBIT blocks are also part of hedged or paired trades rather than pure directional bets. Several of the prints on this chart are flagged as Qualified Contingent Trades, meaning they were executed together with another leg, such as a futures or options position. Prints remain useful as price levels, but always respect the volatility of the underlying.
*As always: anything can happen in the market. This is education, not a recommendation to buy or sell. Only risk what you’re comfortable losing.*
Ready to Trade with Whale-Level Insight?
Get institutional-grade dark pool intelligence delivered to your inbox every week.
Disclaimer: This newsletter is for informational and educational purposes only. It does not constitute financial advice, investment recommendations, or solicitation to buy or sell securities. Trading stocks, ETFs, and options involves substantial risk of loss. Past performance is not indicative of future results.