
📊 How Did We Do? — Last Week’s Scorecard
Every week, we publish institutional dark pool levels with bullish and bearish targets. Here’s how last week’s callouts performed against the actual weekly candle for March 10–14, 2026.
It was one of the most volatile weeks of 2026 — the Iran oil crisis whipsawed markets in both directions, triggering bullish AND bearish levels on multiple tickers in the same week.
✅ 9 of 13 bullish triggers activated | ✅ 9 of 13 bearish triggers activated
| Ticker | Bull Above | Wk High | Bull Targets | Bear Below | Wk Low | Bear Targets |
|---|---|---|---|---|---|---|
| SPY | $680 | $683.36 ✅ | T1-T2 (2) | $670 | $661.36 ✅ | T1-T3 (3) |
| QQQ | $610 | $613.29 ✅ | T1-T2 (2) | $597.50 | $591.33 ✅ | T1-T2 (2) |
| IWM | $255 | $257.65 ✅ | T1-T2 (2) | $250 | $244.39 ✅ | T1-T2 (2) |
| NVDA | $180 | $187.62 ✅ | T1-T5 (5) 🎯 | $177 | $175.56 ✅ | T1 (1) |
| ORCL | $160 | $171.76 ✅ | T1-T3 (3) | $140 | $146.43 ❌ | — |
| RTX | $215 | $213 ❌ | — | $209 | $201.84 ✅ | T1-T4 (4) |
| IOT | $36 | $35.55 ❌ | — | $33 | $31.17 ✅ | T1 (1) |
| PANW | $167.50 | $171.17 ✅ | T1 (1) | $160 | $160.83 ❌ | — |
| DDOG | $127.50 | $131.33 ✅ | T1 (1) | $120 | $121.95 ❌ | — |
| WDAY | $154 | $153.90 ❌ | Miss by $0.10! | $140 | $130.91 ✅ | T1-T3 (3) |
| CRM | $201.25 | $204.86 ✅ | T1 (1) | $189 | $190.60 ❌ | — |
| PINS | $20.50 | $19.91 ❌ | — | $18.50 | $17.83 ✅ | T1 (1) |
| NOW | $125 | $126.67 ✅ | T1 (1) | $114 | $111.71 ✅ | T1-T2 (2) |
- ⭐ Star Performer: NVDA — all 5 bullish targets hit ($180 → $187.62). A clean sweep.
- 📉 Biggest Bearish Move: RTX — 4 bearish targets hit ($209 → $201.84) as defense stocks rotated.
- 😤 Near Miss: WDAY bullish trigger missed by just $0.10 ($153.90 vs $154).
- 🔄 Five tickers (SPY, QQQ, IWM, NVDA, NOW) triggered BOTH bullish and bearish levels — extreme volatility driven by the Iran crisis.
📈 Market Overview — Week of March 10–14, 2026
- Total block trades (50K+ shares): 29,978 prints
- Total dark pool dollar volume: $332.2 billion
- Friday alone: $83.2 billion across 4,025 price levels
- Most active sectors: Energy, Defense, Technology
The S&P 500 fell to a new 2026 low and posted its third consecutive losing week — the first three-week losing streak in about a year. The Dow dropped 2% for the week, the S&P 500 lost 1.6%, and the Nasdaq fell 1.3%.
The catalyst: Iran. On Thursday, March 12, Iranian forces struck two oil tankers, sending crude prices surging toward $100 per barrel. All three major U.S. stock indexes dropped more than 1.5% in a broad selloff, with everything except energy and defense stocks suffering steep losses. On Friday, Iran’s new Supreme Leader Mojtaba Khamenei declared that the Strait of Hormuz — through which roughly 20% of the world’s oil passes — should remain shut as a “tool to pressure the enemy.”
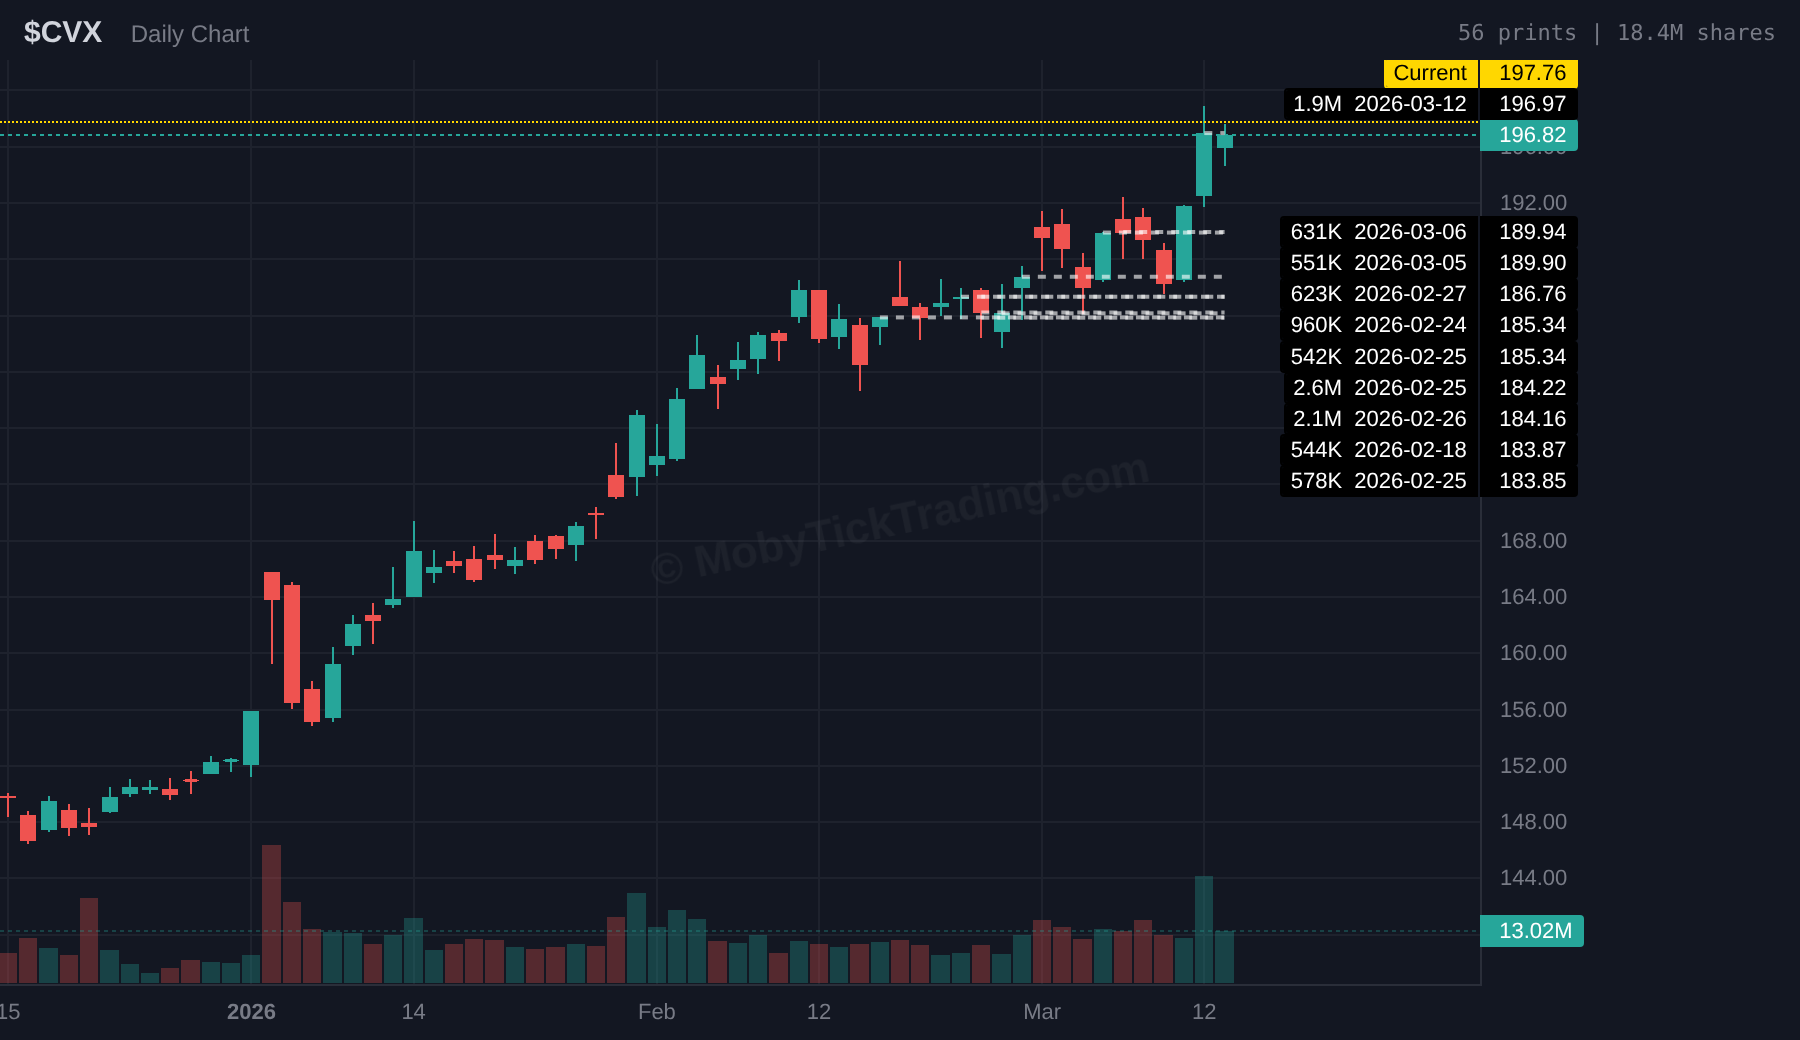
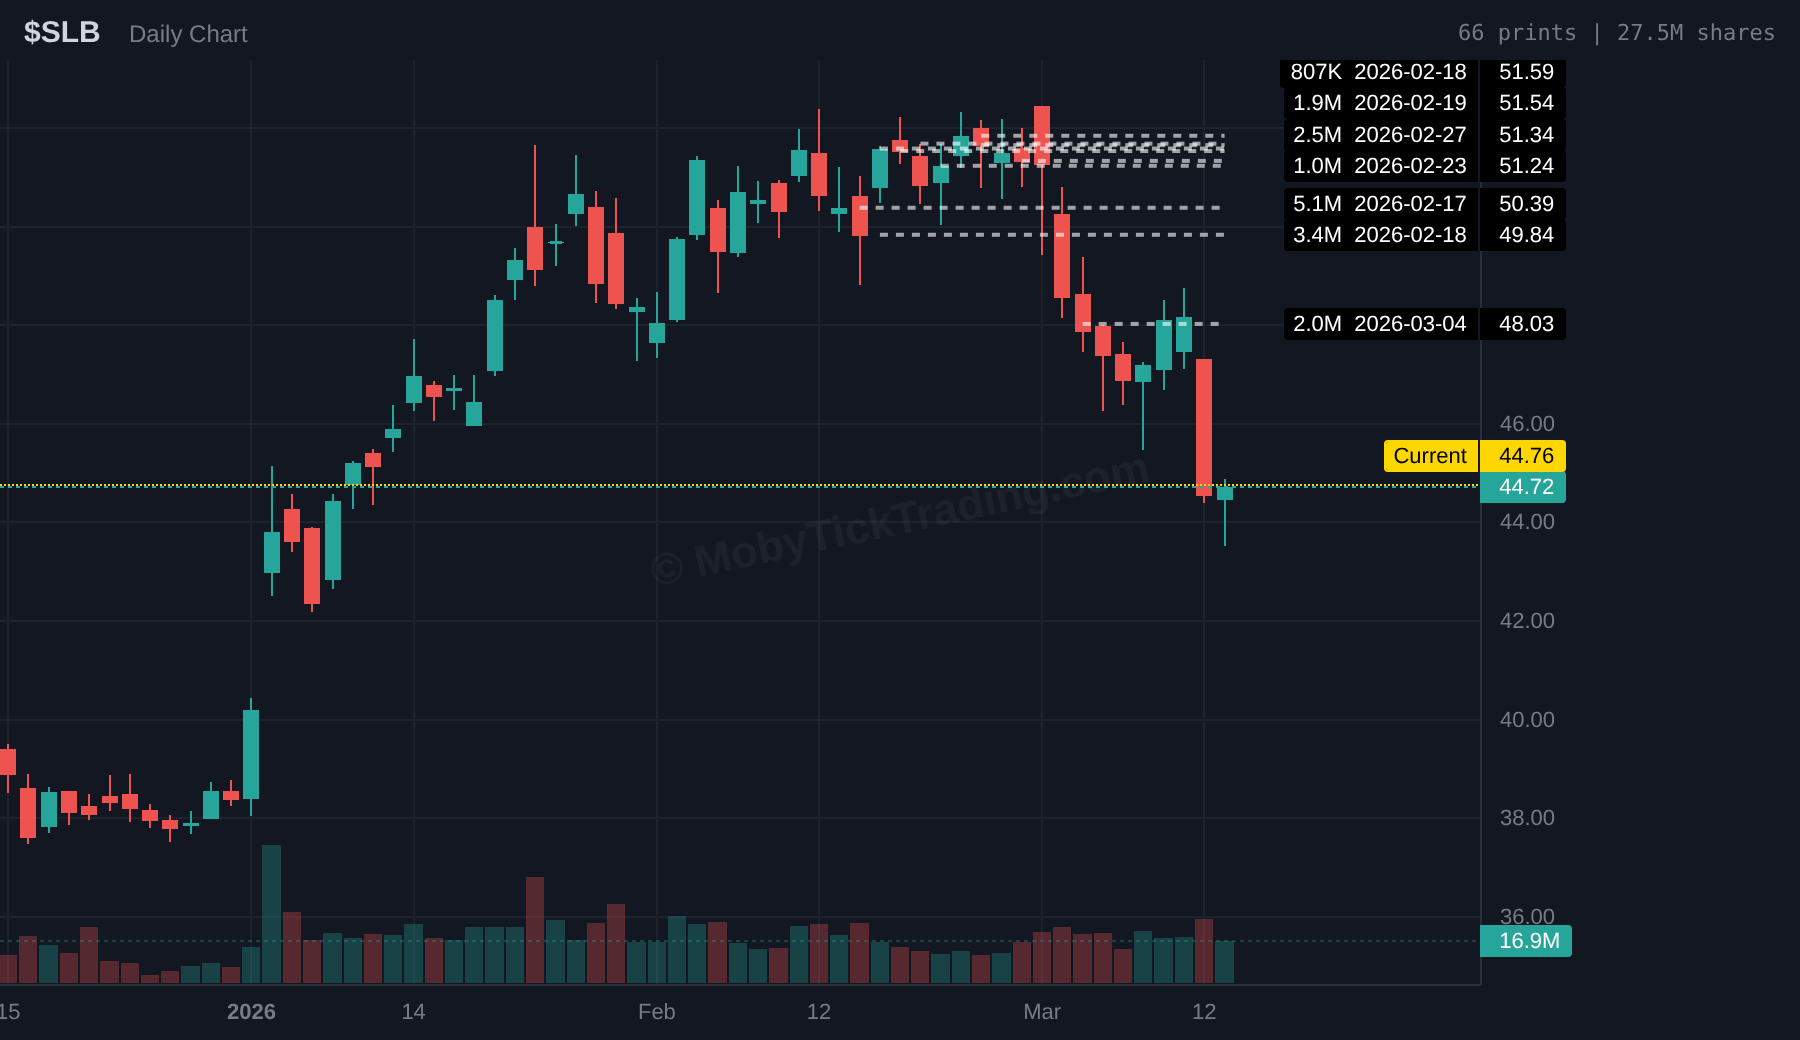
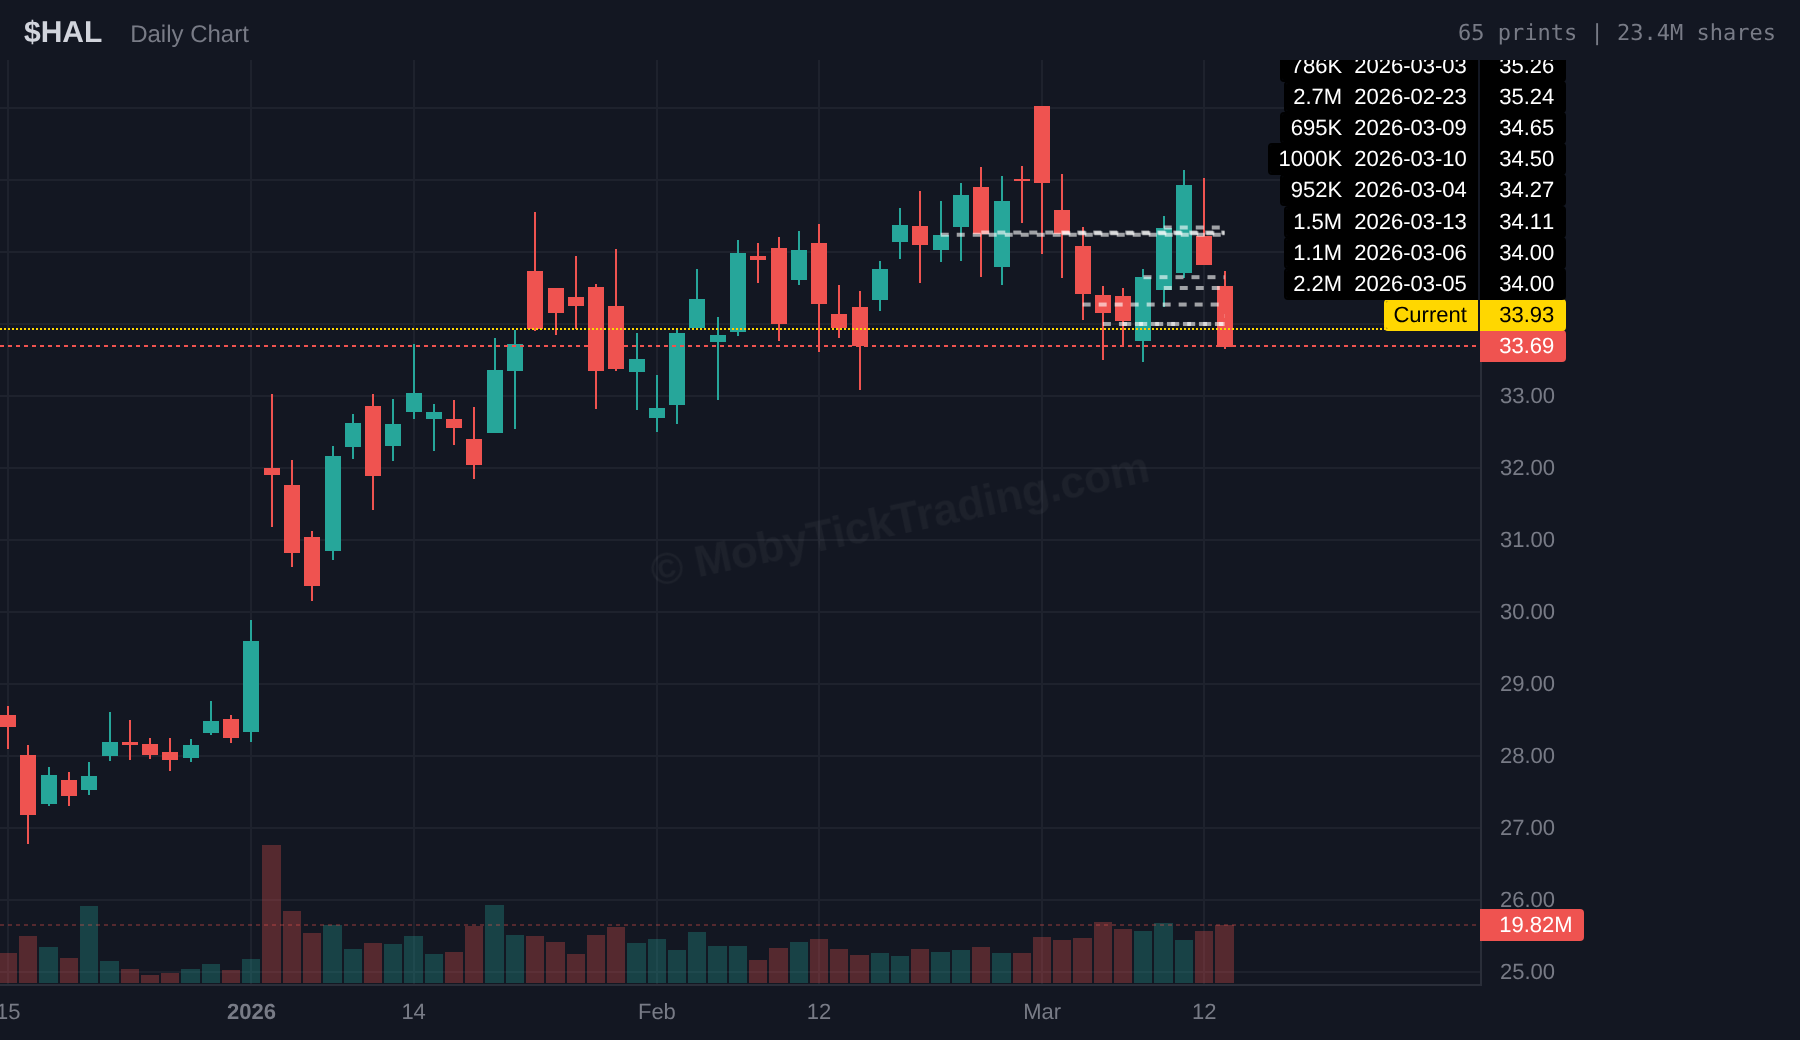
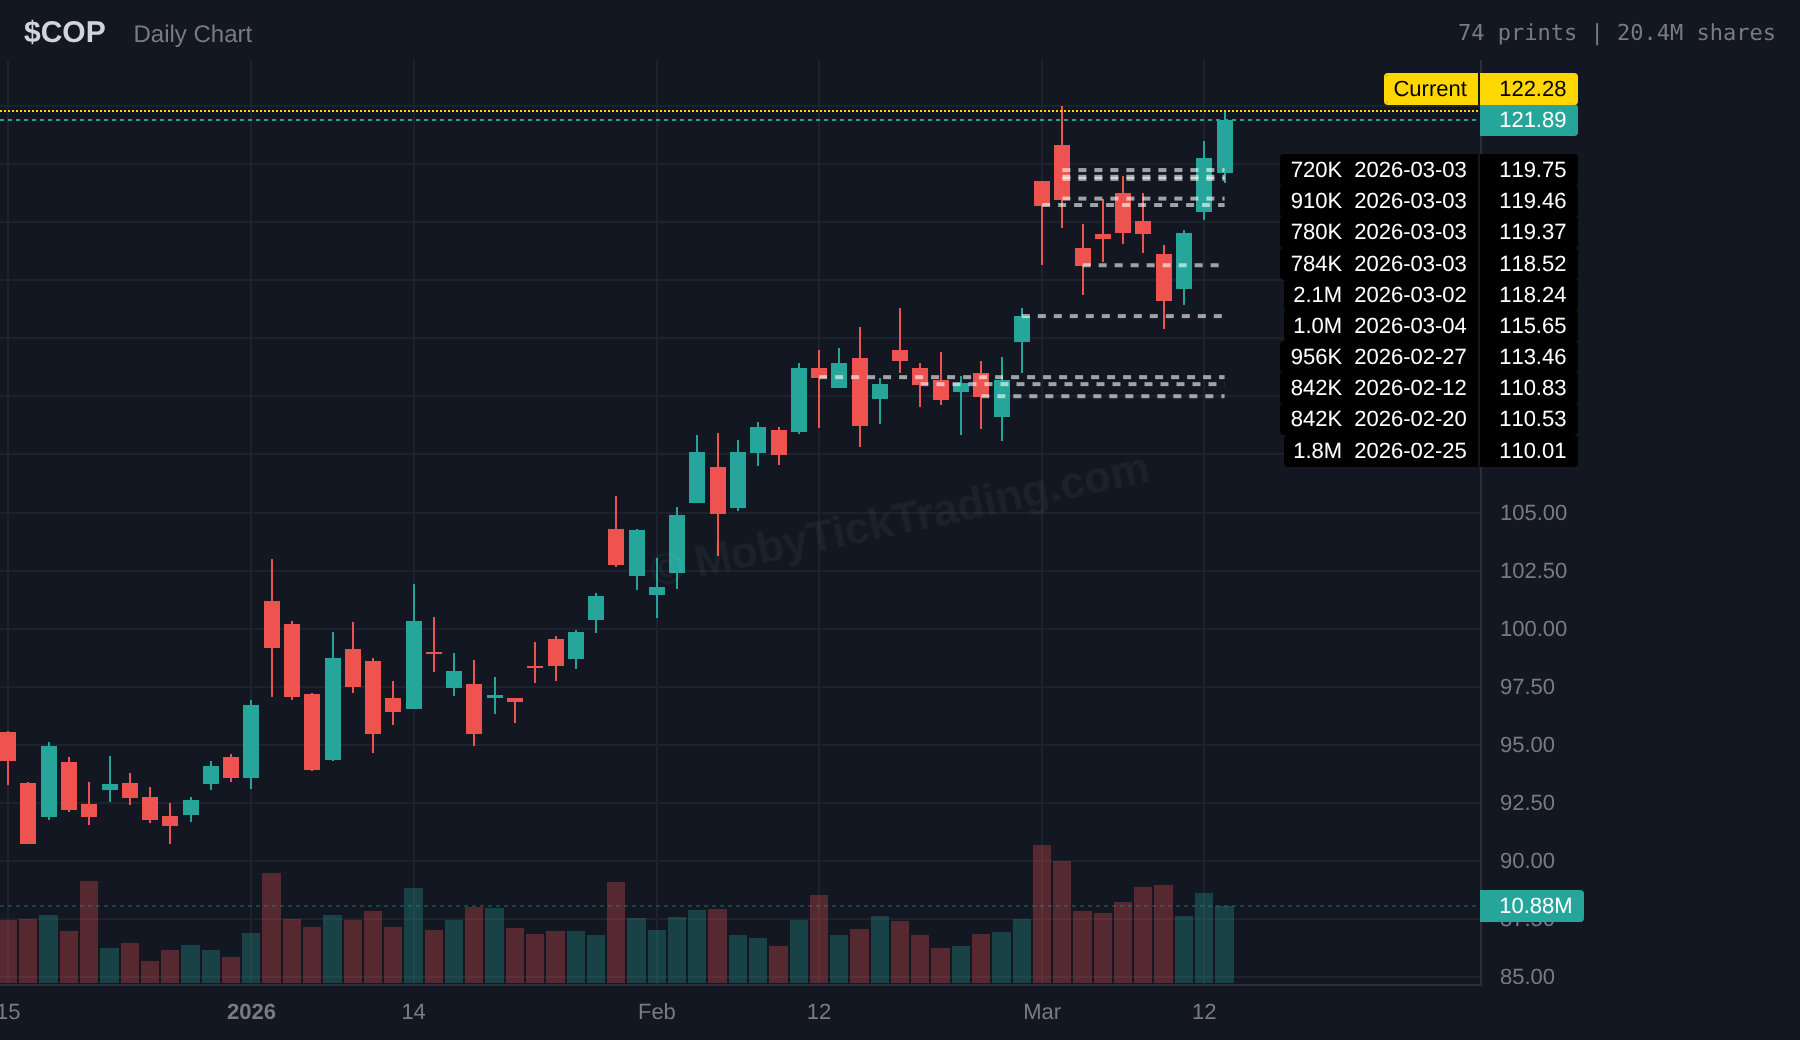
The result was a dramatic sector rotation visible in real time through dark pool data. While broad market ETFs saw heavy selling, defense ETFs like IDEF and ITA recorded historic institutional inflows. Energy stocks — XOM, CVX, SLB, HAL, COP — lit up across the board. The money didn’t disappear. It moved.
🏆 Print of the Week: IDEF — 43.9 Million Shares in a Single Day
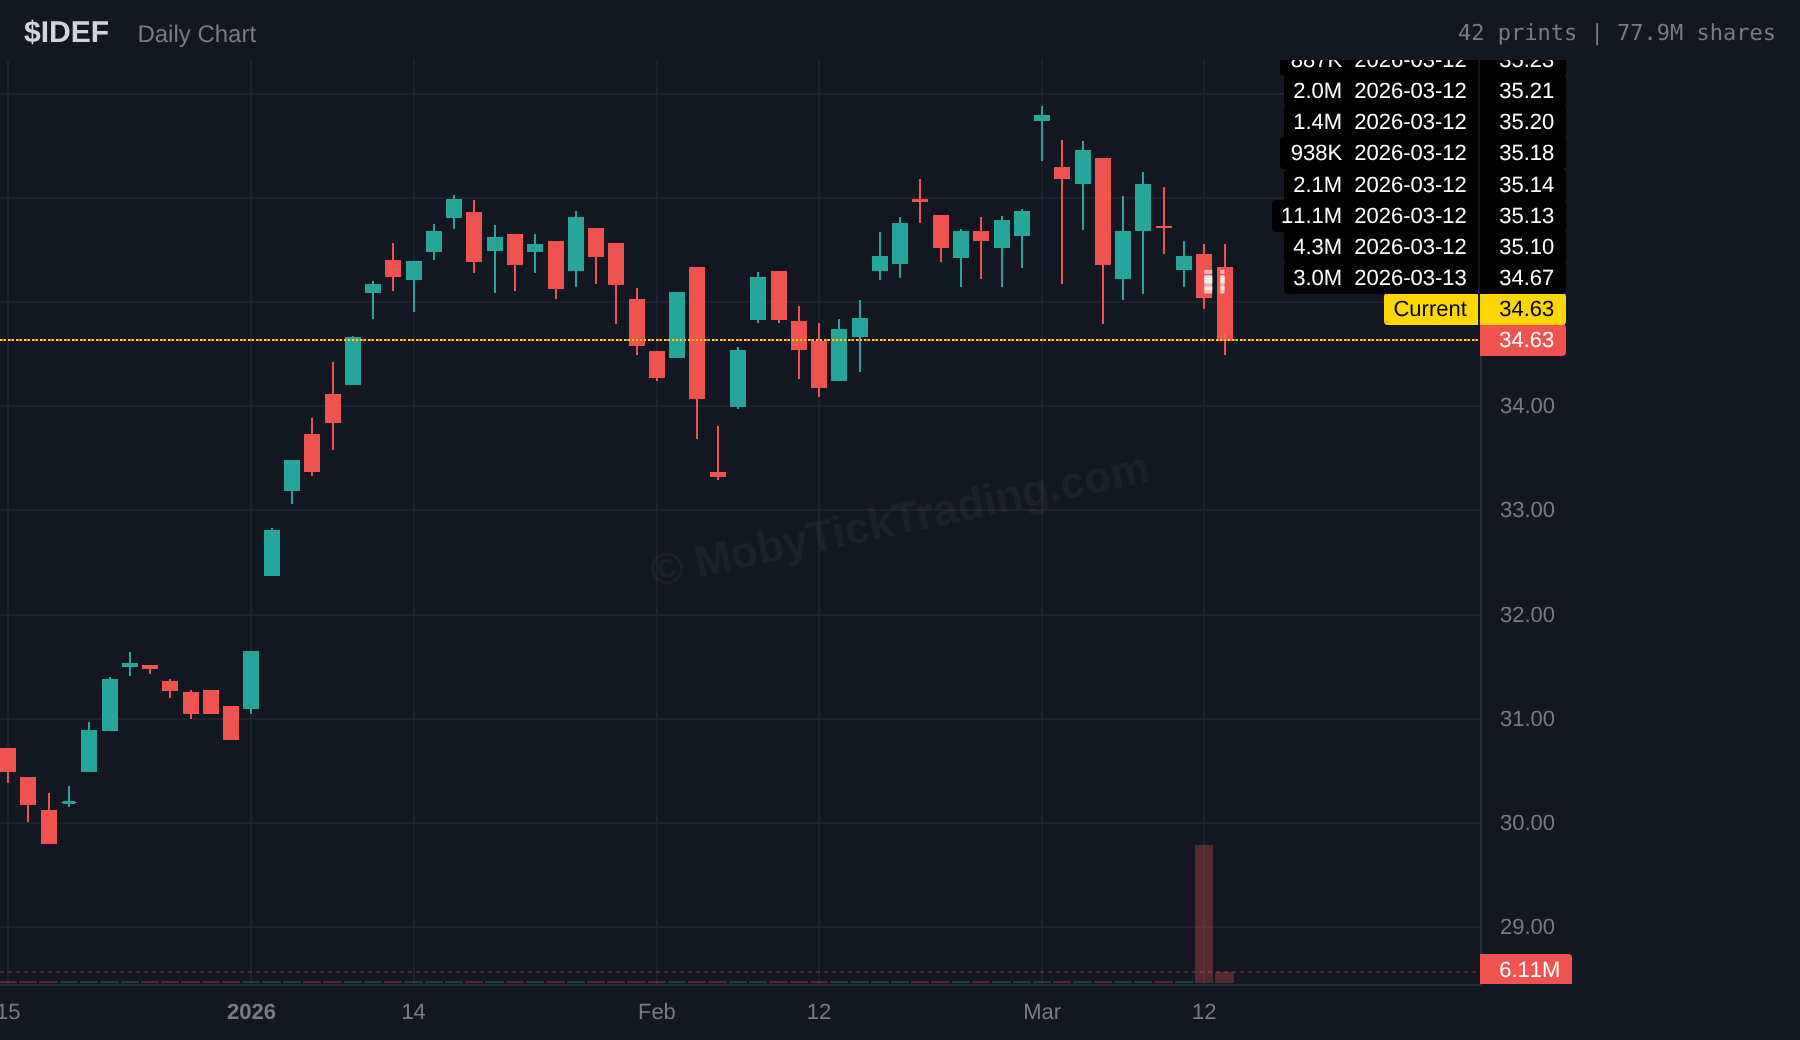
The iShares Defense Industrials Active ETF (IDEF) printed 43.9 million shares at $35.24 on March 12 alone — worth $1.55 billion. For an ETF with just $118 million in total assets, that single dark pool print cluster was worth more than 13 times the entire fund. In total, IDEF saw 76.8 million shares and $2.7 billion in dark pool activity across March 12–13, across 80 individual prints.
For context, IDEF’s average daily trading volume on Friday was 6.1 million shares. That March 12 print was 7x normal volume — in the dark pool alone. Before this week, the biggest dark pool print on IDEF was 755,000 shares back on February 12. This represents a 58x increase in institutional activity overnight.
🎯 Trade Setups — Entries & Targets (March 16–20, 2026)
Based on institutional dark pool levels from the past 60–90 days. These are NOT recommendations — they are institutional-grade support and resistance levels for your watchlist.
How to use these levels: Wait for a closing confirmation in the last 15 minutes of the trading day. If price closes above the “Above” level, the bullish targets are in play. If price closes below the “Below” level, the bearish targets are active. Do NOT chase entries mid-day — let the close confirm the direction.
📈 Bullish Targets
| Ticker | Price | Above | T1 | T2 | T3 | T4 | T5 |
|---|---|---|---|---|---|---|---|
| SPY | $662.29 | $667.50 | $670 | $672.50 | $675 | $677.50 | $679 |
| QQQ | $593.44 | $598 | $600 | $602.50 | $605 | $606 | $608 |
| IWM | $246.59 | $250 | $251.25 | $252.50 | $255 | $257.50 | $259 |
| NVDA | $180.20 | $190 | $192.50 | $195 | $196.25 | $197.50 | $200 |
| XOM | $156.45 | $157.50 | $158.25 | $160 | $162.50 | $165 | $167.50 |
| AVGO | $321.09 | $348 | $350 | $355 | $357.50 | $360 | $370 |
| BA | $209.26 | $212.50 | $215 | $219 | $222.50 | $225 | $230 |
| MU | $425 | $430 | $440 | $447.50 | $450 | $460 | $475 |
| AMD | $192.88 | $202.50 | $205 | $207.50 | $210 | $211.50 | $213.50 |
| KRE | $63.11 | $65 | $66.25 | $67.50 | $70 | $71 | $72.50 |
| VZ | $51.46 | $52 | $53 | $54 | $55 | $56 | $57.50 |
| IDEF | $34.63 | $35.50 | $36.25 | $37.50 | $38.25 | $40 | $41.25 |
| ITA | $229.34 | $235 | $237.50 | $240 | $241.75 | $245 | $250 |
📉 Bearish Targets
| Ticker | Price | Below | T1 | T2 | T3 | T4 | T5 |
|---|---|---|---|---|---|---|---|
| SPY | $662.29 | $659 | $657.50 | $655 | $652.50 | $650 | $645 |
| QQQ | $593.44 | $590 | $587.50 | $585 | $582.50 | $580 | $575 |
| IWM | $246.59 | $245 | $243.25 | $240 | $237.50 | $235 | $232.50 |
| NVDA | $180.20 | $175 | $172.50 | $170 | $167.50 | $165 | — |
| XOM | $156.45 | $149 | $148 | $147 | $146 | $144 | $142.50 |
| AVGO | $321.09 | $317.50 | $315 | $310 | $308 | $305 | $300 |
| BA | $209.26 | $205 | $204 | $202.50 | $200 | $197.50 | $195 |
| MU | $425 | $410 | $405 | $400 | $390 | $380 | $370 |
| AMD | $192.88 | $190 | $187.50 | $185 | $182.50 | $180 | $175 |
| KRE | $63.11 | $62 | $61 | $60 | $59 | $57.50 | $55 |
| VZ | $51.46 | $50 | $49.50 | $49 | $48 | $47 | $46 |
| IDEF | $34.63 | $34 | $33.25 | $32.50 | $31.25 | $30 | $27.50 |
| ITA | $229.34 | $227.50 | $225 | $222.50 | $220 | $217.50 | — |
👀 What to Watch This Week
- Micron (MU) earnings — Tuesday, March 18 (after close). DRAM prices have surged 100%.
- Accenture (ACN) earnings — Wednesday, March 19 (before open). Truist cut price target to $260.
- Williams-Sonoma (WSM) earnings — Tuesday, March 18.
- Iran/Oil developments — Strait of Hormuz situation evolving daily. Oil near $100/barrel.
- Fed commentary — Watch for inflation concerns driven by rising oil prices.
- SPY $659 level — Below bearish trigger, next support $650–$655. Dec late prints at $679 (20M shares) are overhead resistance.
🔎 Deep Dive: Defense Sector — Institutional Rotation in Real Time
IDEF (iShares Defense Industrials Active ETF)
Current: $34.63 | Weekly Change: -1.2% | 60-Day Prints: 76.8M shares, $2.7B, 80 prints
IDEF is a relatively new defense ETF with just $118 million in total assets. What happened this week was extraordinary: institutions poured $2.7 billion through dark pools into this small ETF — more than 20 times its total assets. The 43.9 million share print on March 12 alone was the largest dark pool print we’ve ever recorded on a defense ETF.
The top 10 holdings of IDEF read like a defense contractor roster: RTX (8.87%), LMT (5.52%), GD (5.09%), NOC (4.13%), PLTR (3.47%), BA (2.02%), and GE Aerospace (1.86%). The dark pool activity in IDEF’s underlying holdings confirms the institutional conviction:
- RTX: 11.1M shares, $2.3B in 60-day dark pool prints
- GE Aerospace: 8.3M shares, $2.8B
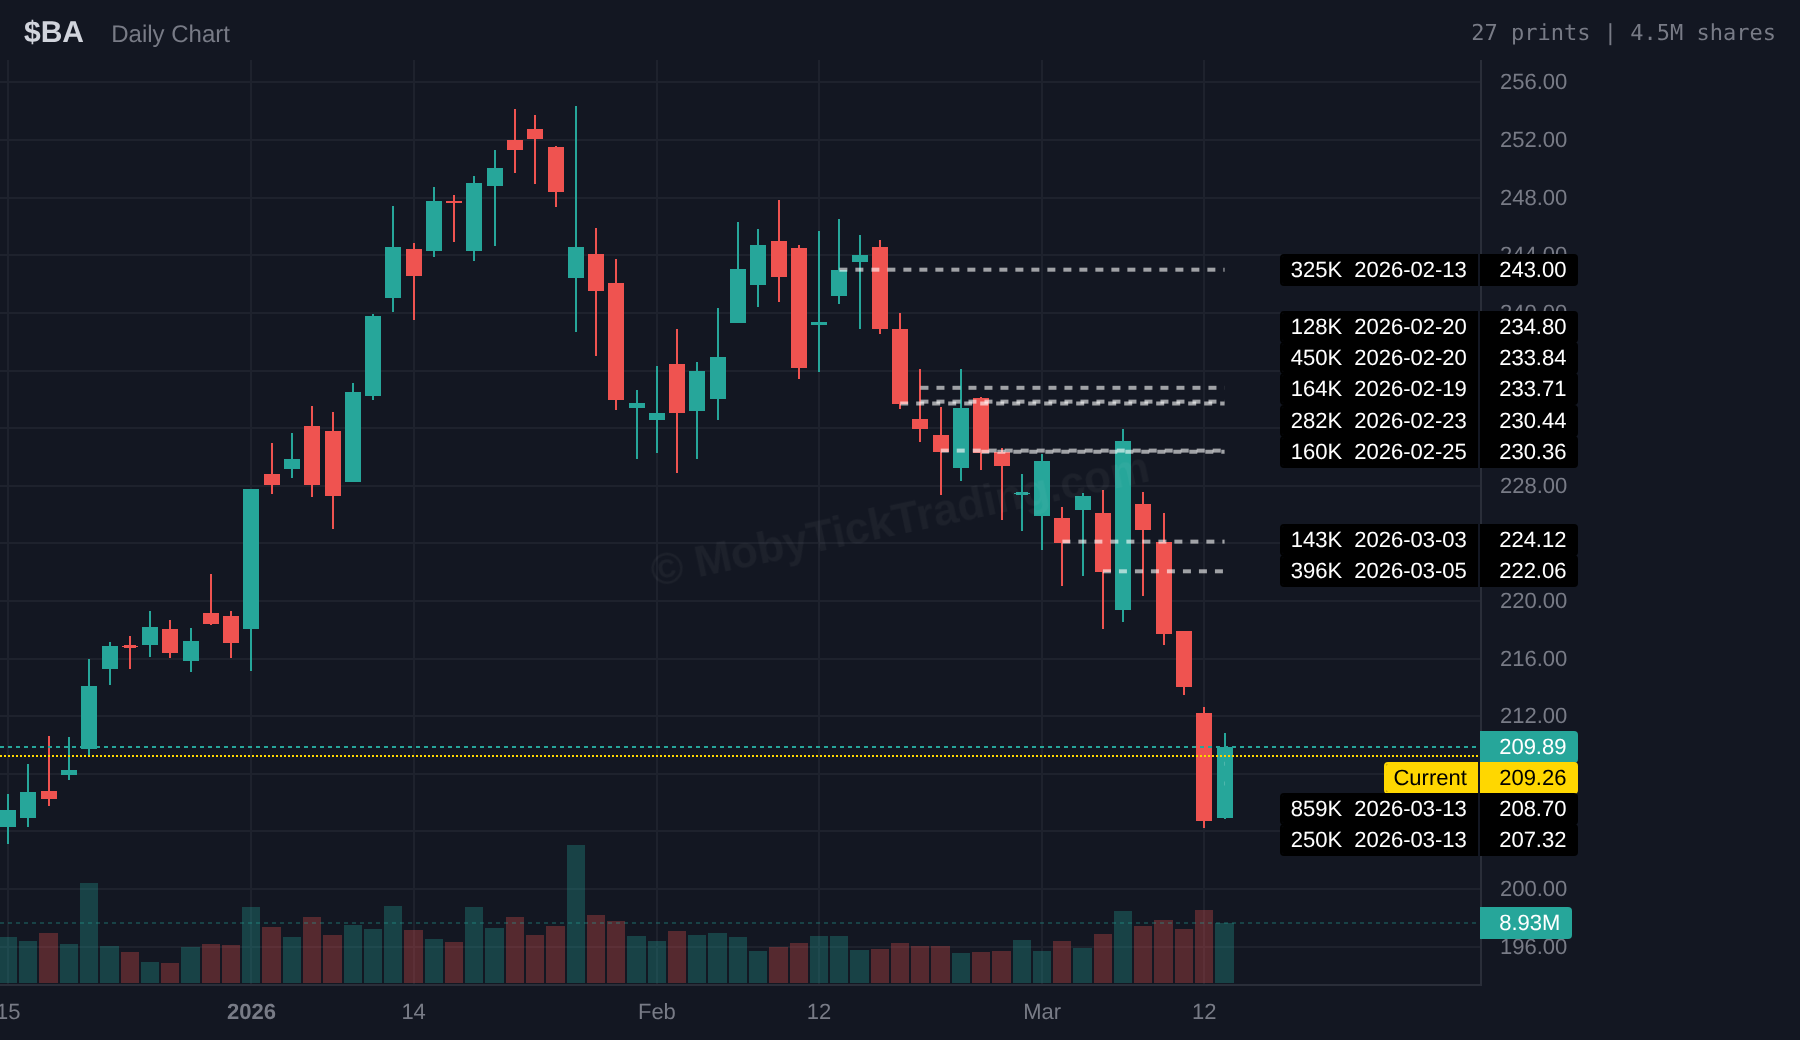
- BA: 4.2M shares, $926M — prints dropping from $243 (Feb 13) → $208 (Mar 13)
- NOC: 857K shares, $614M
- LMT: 861K shares, $566M
ITA (iShares Aerospace & Defense ETF)
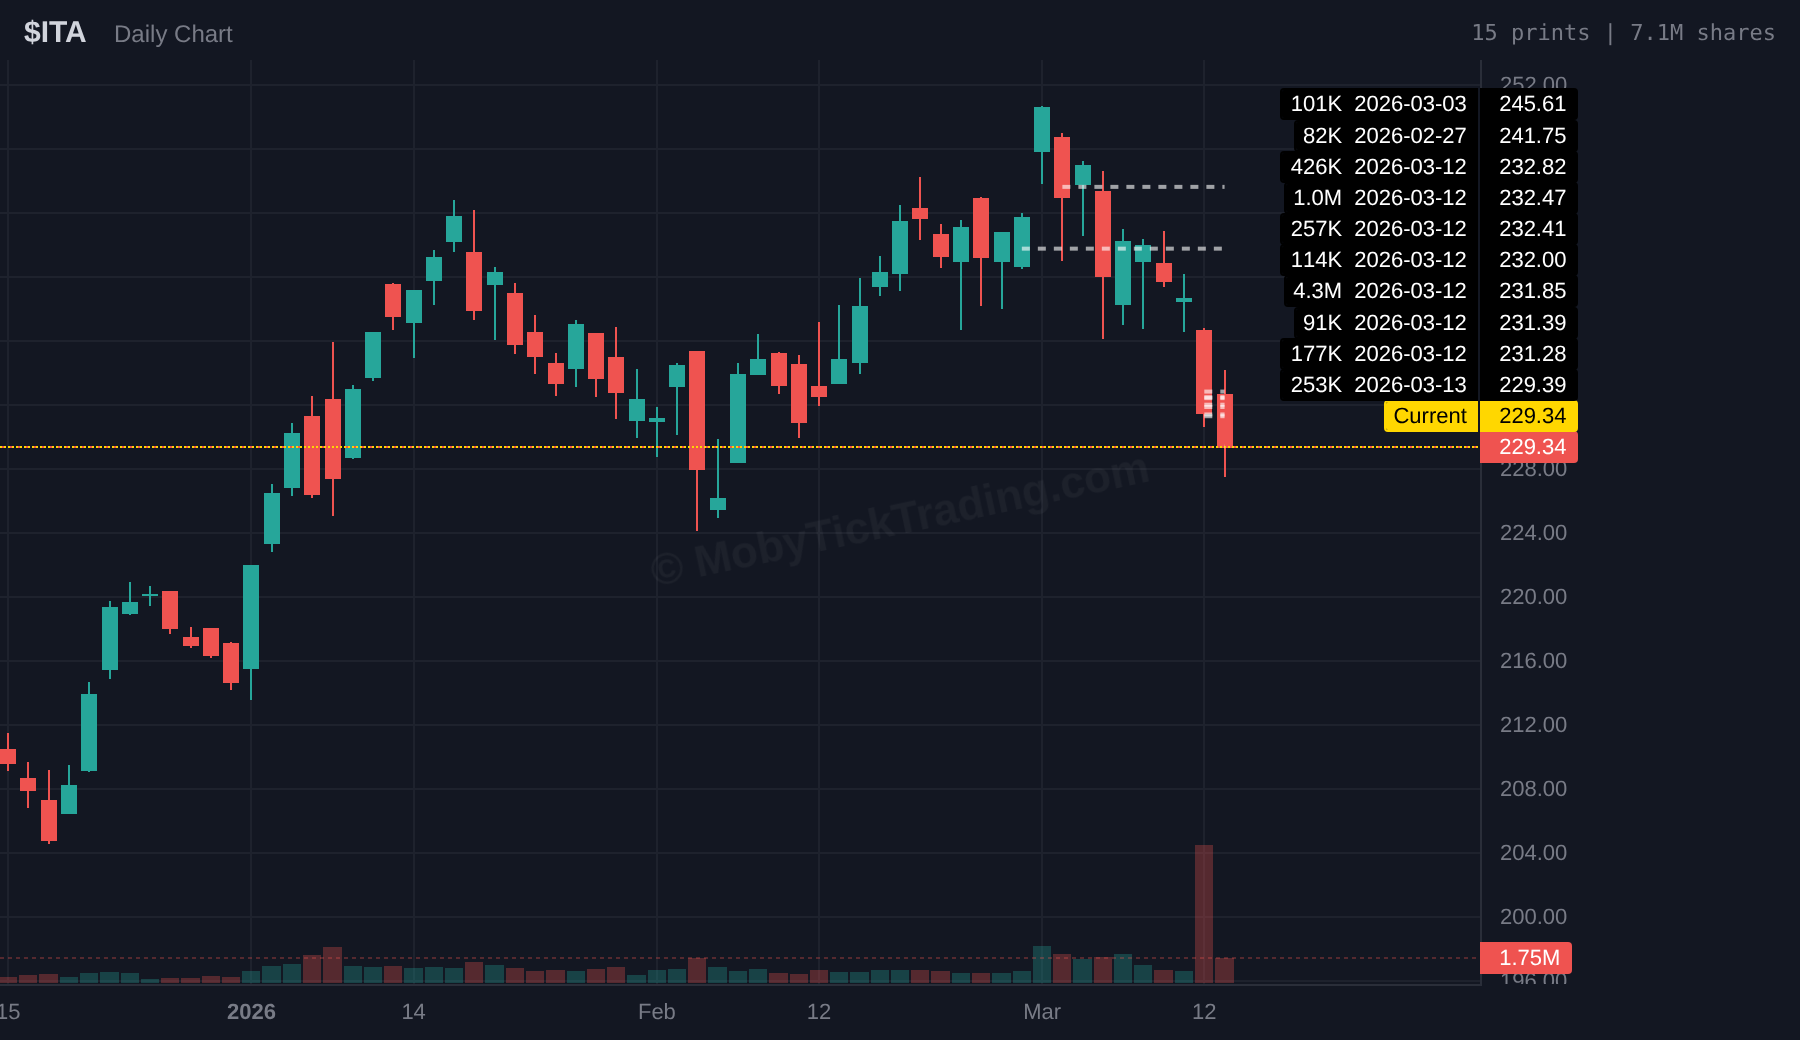
Current: $229.34 | Weekly Change: -2.15% | 60-Day Prints: 5.7M shares, $1.32B
ITA saw a massive 4.3 million share print at $231.85 on March 12 — worth $992 million. Nearly all of ITA’s dark pool activity occurred on March 12, the same day as the IDEF explosion. Two defense ETFs. Same day. Same thesis: institutions are positioning for a sustained defense spending cycle.
🔎 Deep Dive: Energy Sector — Following the Oil Money
XOM (Exxon Mobil)
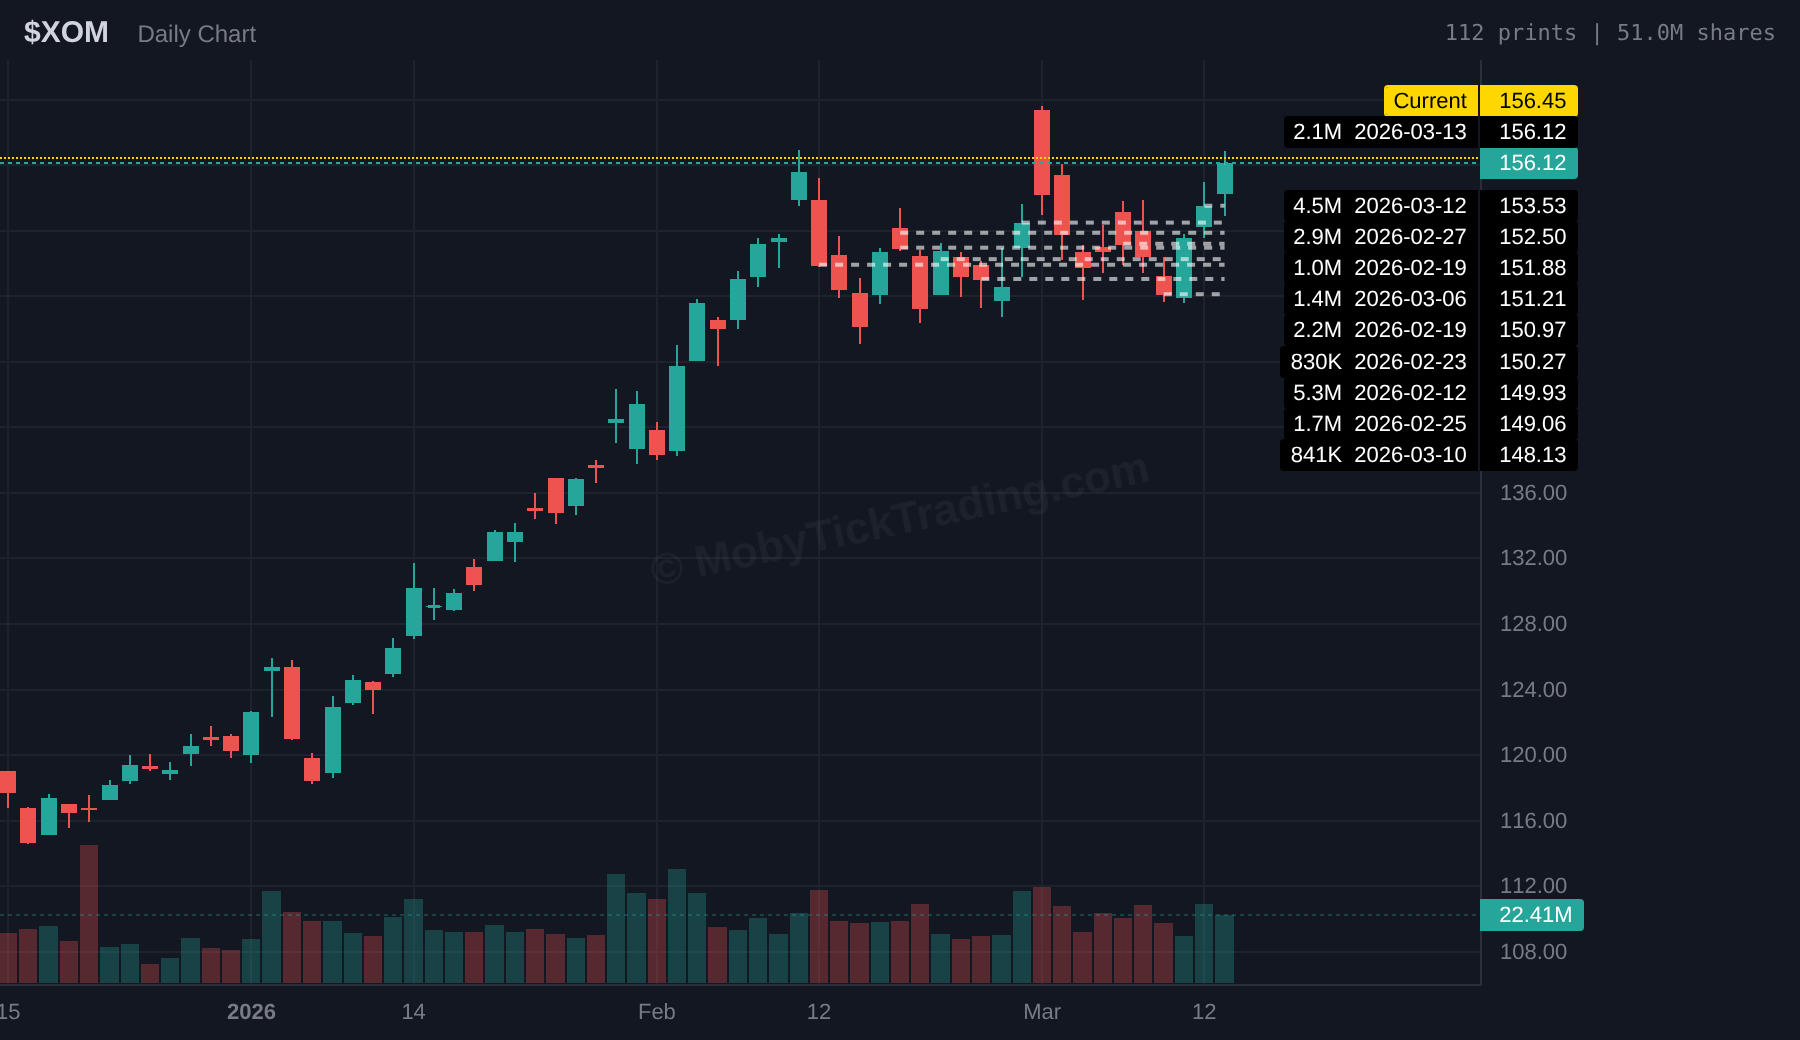
Current: $156.45 | Weekly Change: +2.92% | 60-Day Prints: 42.1M shares, $6.4B, 166 prints
Exxon Mobil has been the most heavily printed energy stock over the past 60 days — $6.4 billion in dark pool activity across 166 individual prints. Prints started at $148–$150 in mid-February and have climbed steadily to $156 as oil prices rose.
XLE (Energy Select Sector SPDR)
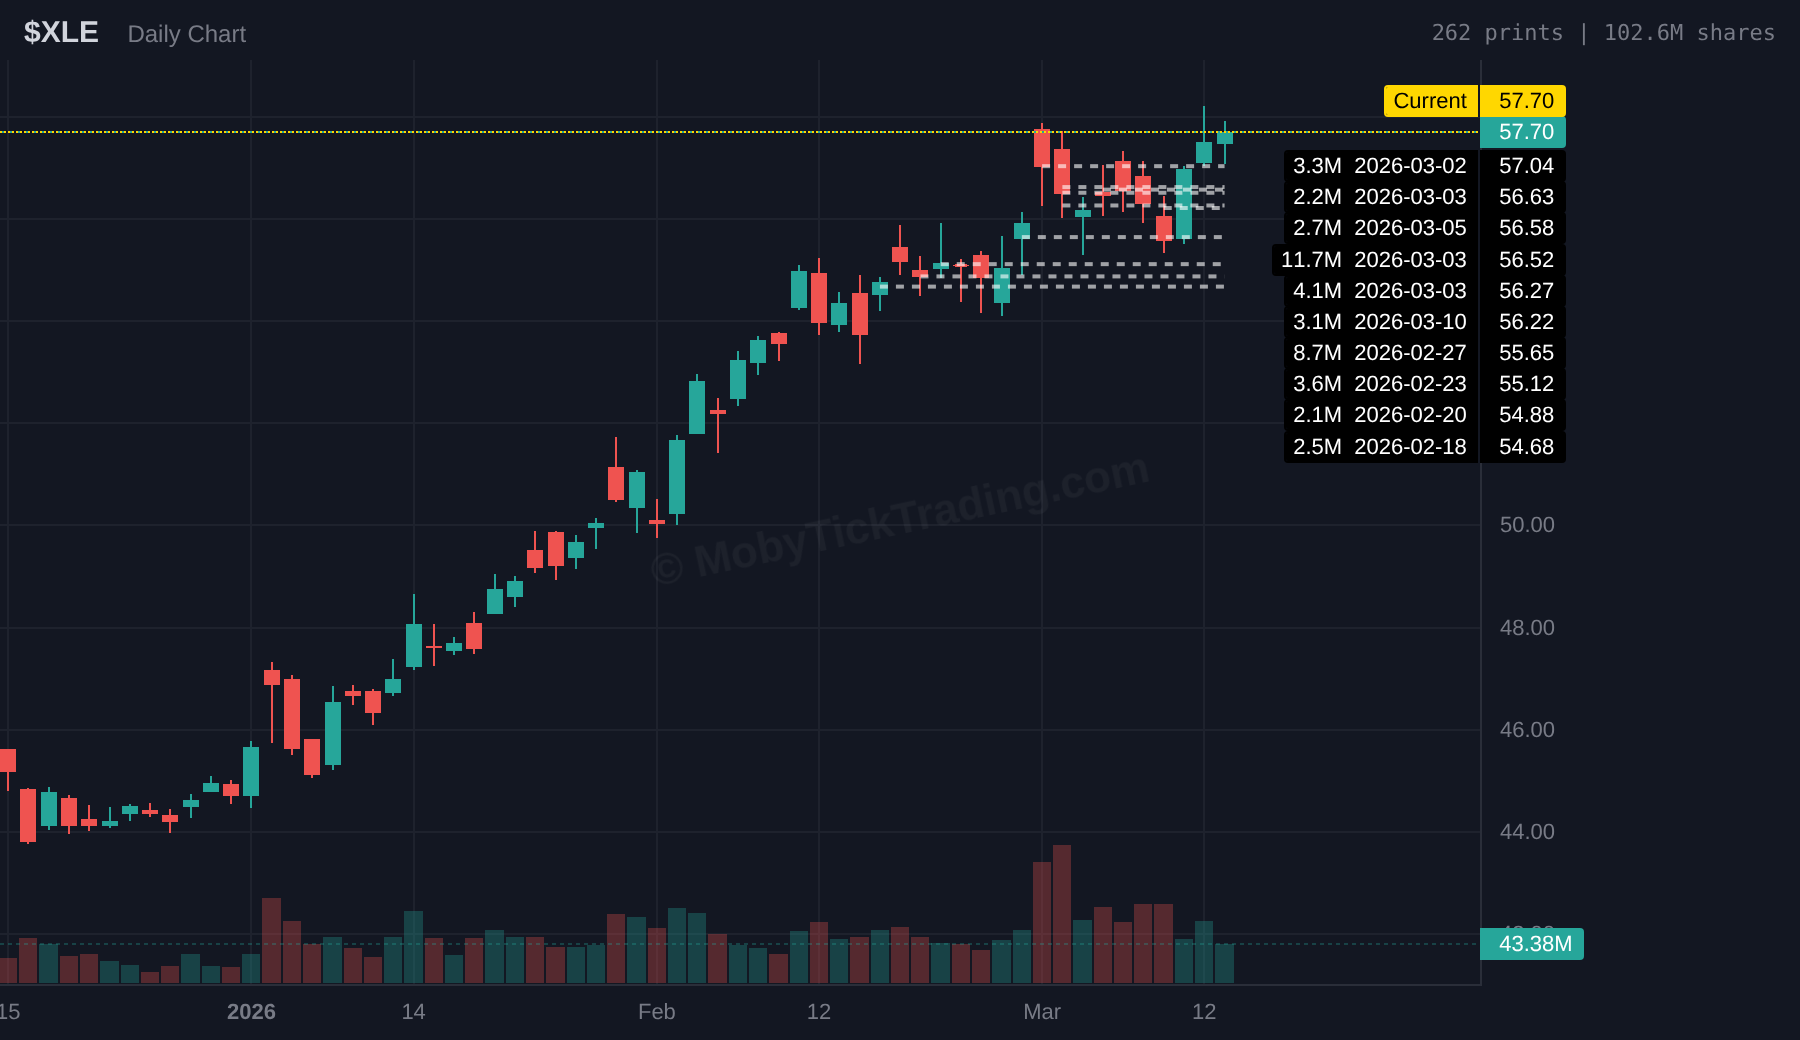
30-Day Prints: 87.8M shares, $4.9B, 162 prints
XLE saw nearly $5 billion in dark pool activity over the past 30 days. The largest print was 11.7M shares at $56.52 on March 3, worth $661 million.
The Full Energy Picture (60-Day Totals)
- XOM: 42.1M shares — $6.4B (166 prints)
- CVX: 17.6M shares — $3.3B (85 prints)
- COP: 19.4M shares — $2.2B (101 prints)
- SLB: 26.6M shares — $1.3B (96 prints)
- HAL: 23.0M shares — $799M (83 prints)
- OXY: 11.2M shares — $600M (69 prints)
- PSX: 4.8M shares — $767M (17 prints)
- DVN: 7.5M shares — $332M (45 prints)
- Total energy sector: ~$25 billion in institutional positioning
🔎 Deep Dive: SPY — Below the December Institutional Wall
Current: $662.29 | Weekly Change: -0.57% | 90-Day Prints: 21.1M shares this week, $14.1B
On December 16 and 17, 2025, two massive late prints hit the dark pool for SPY:
- December 16: 12,071,825 shares @ $679.10 = $8.2 billion
- December 17: 7,897,010 shares @ $679.11 = $5.4 billion
Combined: 19.97 million shares at essentially the same price ($679.10–$679.11), worth $13.6 billion. SPY closed Friday at $662.29 — 2.5% below this wall. The $679 level is now overhead resistance.
Looking at the 90-day picture, institutions have been building positions at progressively lower prices: $692 (Feb 12) → $685 (Mar 4-5) → $681 (Mar 5-6) → $672 (Mar 6) → $666 (Mar 12) → $662 (Mar 13).
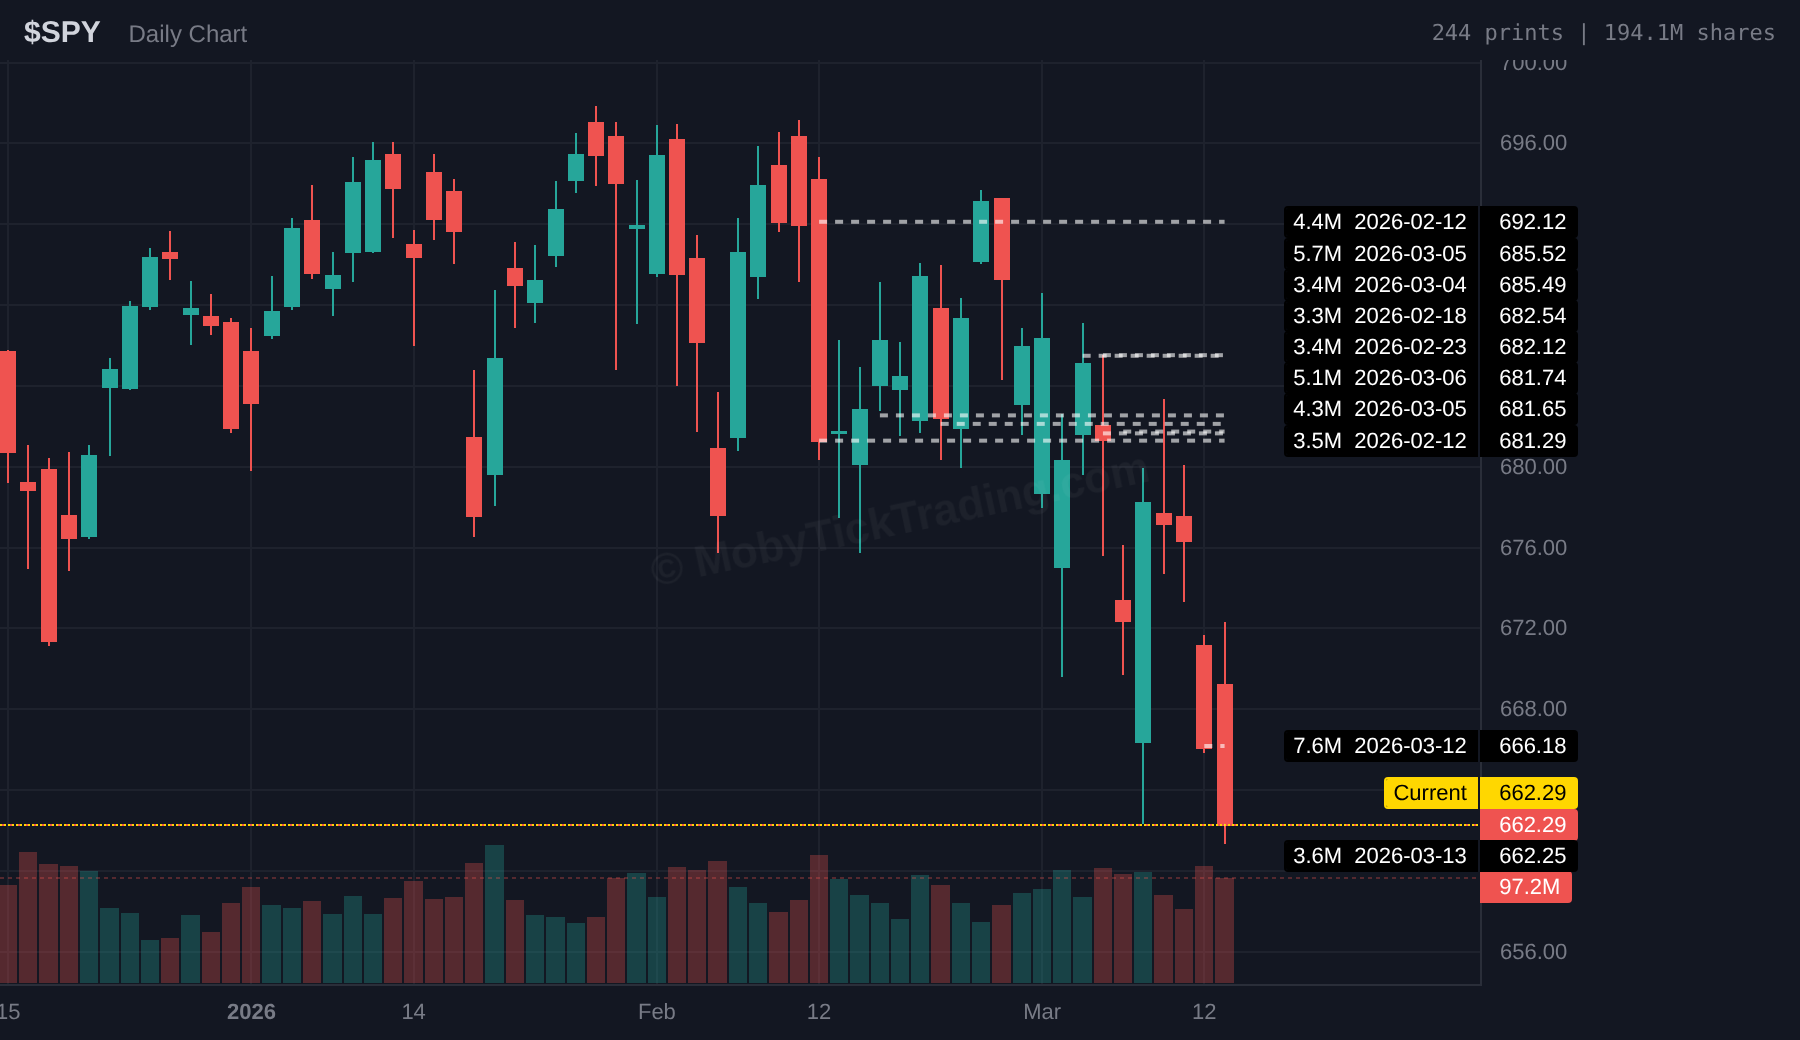
Key Institutional Levels (90-day)
- $662–$666 — Fresh prints this week (potential support zone)
- $672–$676 — Mid-range cluster
- $679–$686 — Heavy overhead supply (Dec late prints + Feb/Mar cluster)
- $692 — February high watermark
🔎 Deep Dive: MU (Micron) — Pre-Earnings Positioning
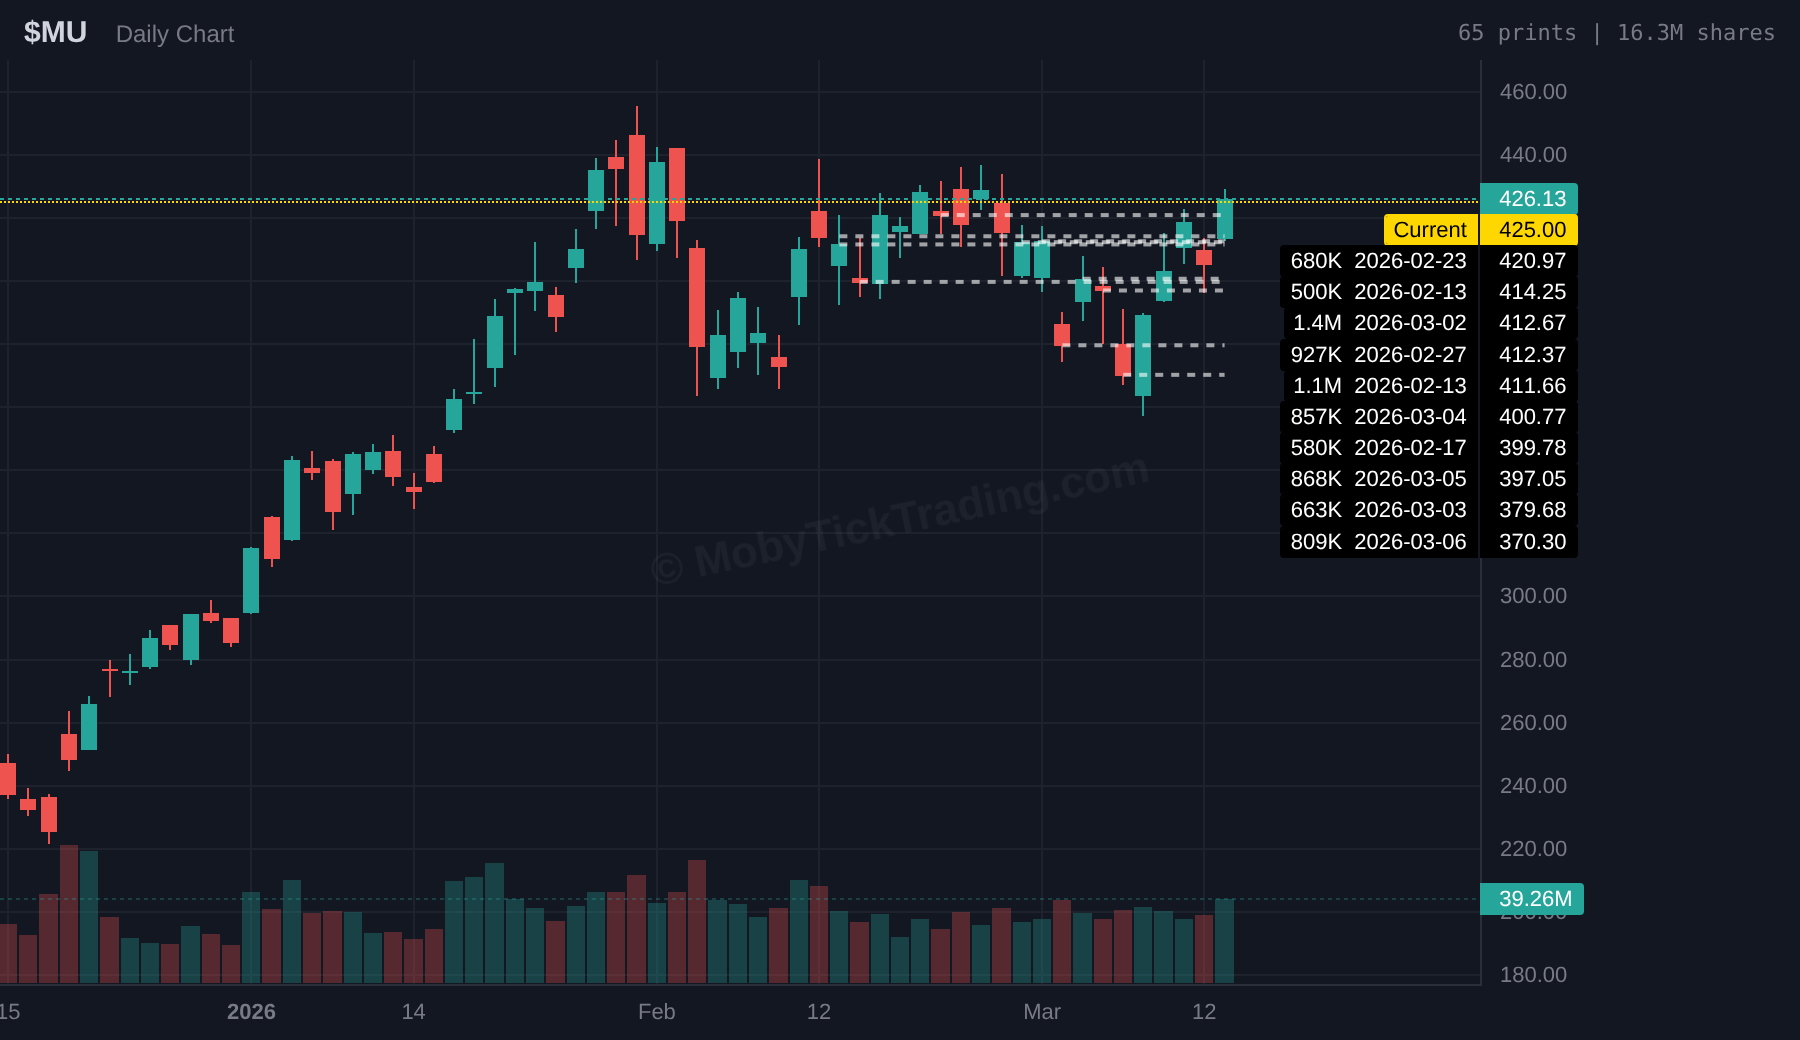
Current: $425 | Earnings: Tuesday, March 18 (after close) | 60-Day Prints: 13.5M shares, $5.5B, 101 prints
Micron reports fiscal Q2 earnings on Tuesday. DRAM prices have surged 100% year-over-year, driven by AI memory demand. Over the past 60 days, institutions have printed 13.5 million shares worth $5.5 billion.
- $397–$414 zone: Heavy accumulation. Largest print: 1.4M shares at $412.67 on March 2 ($596M).
- $370 level: 809K share print on March 6 at the pullback low.
- $420–$425 zone: Recent prints near current price.
🔎 More Institutional Highlights
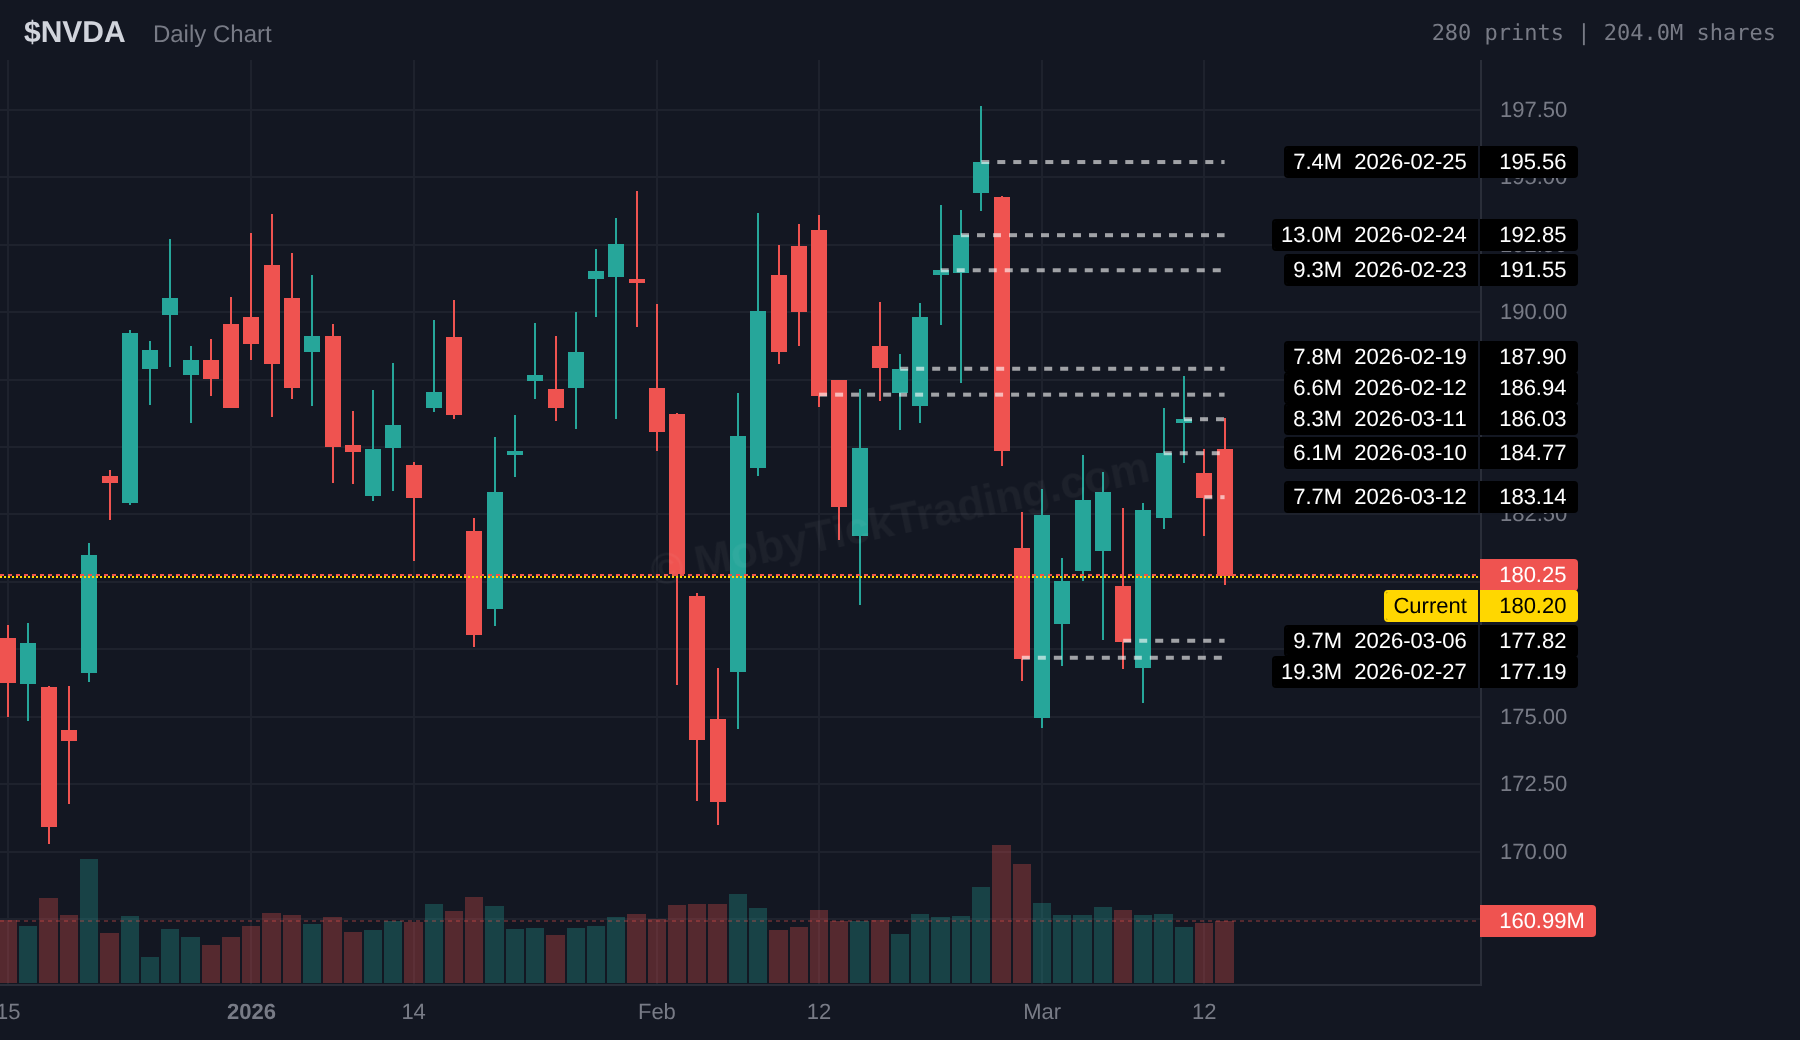
NVDA — All 5 Bullish Targets Hit Last Week
Current: $180.20. NVDA swept all 5 bullish targets from $180 to $187.62. The 60-day picture shows massive activity: 19.3M shares at $177.19 (Feb 27), 13M shares at $192.85 (Feb 24). The $175–$180 zone is heavily supported.
AVGO — $1.7 Billion Print on Friday
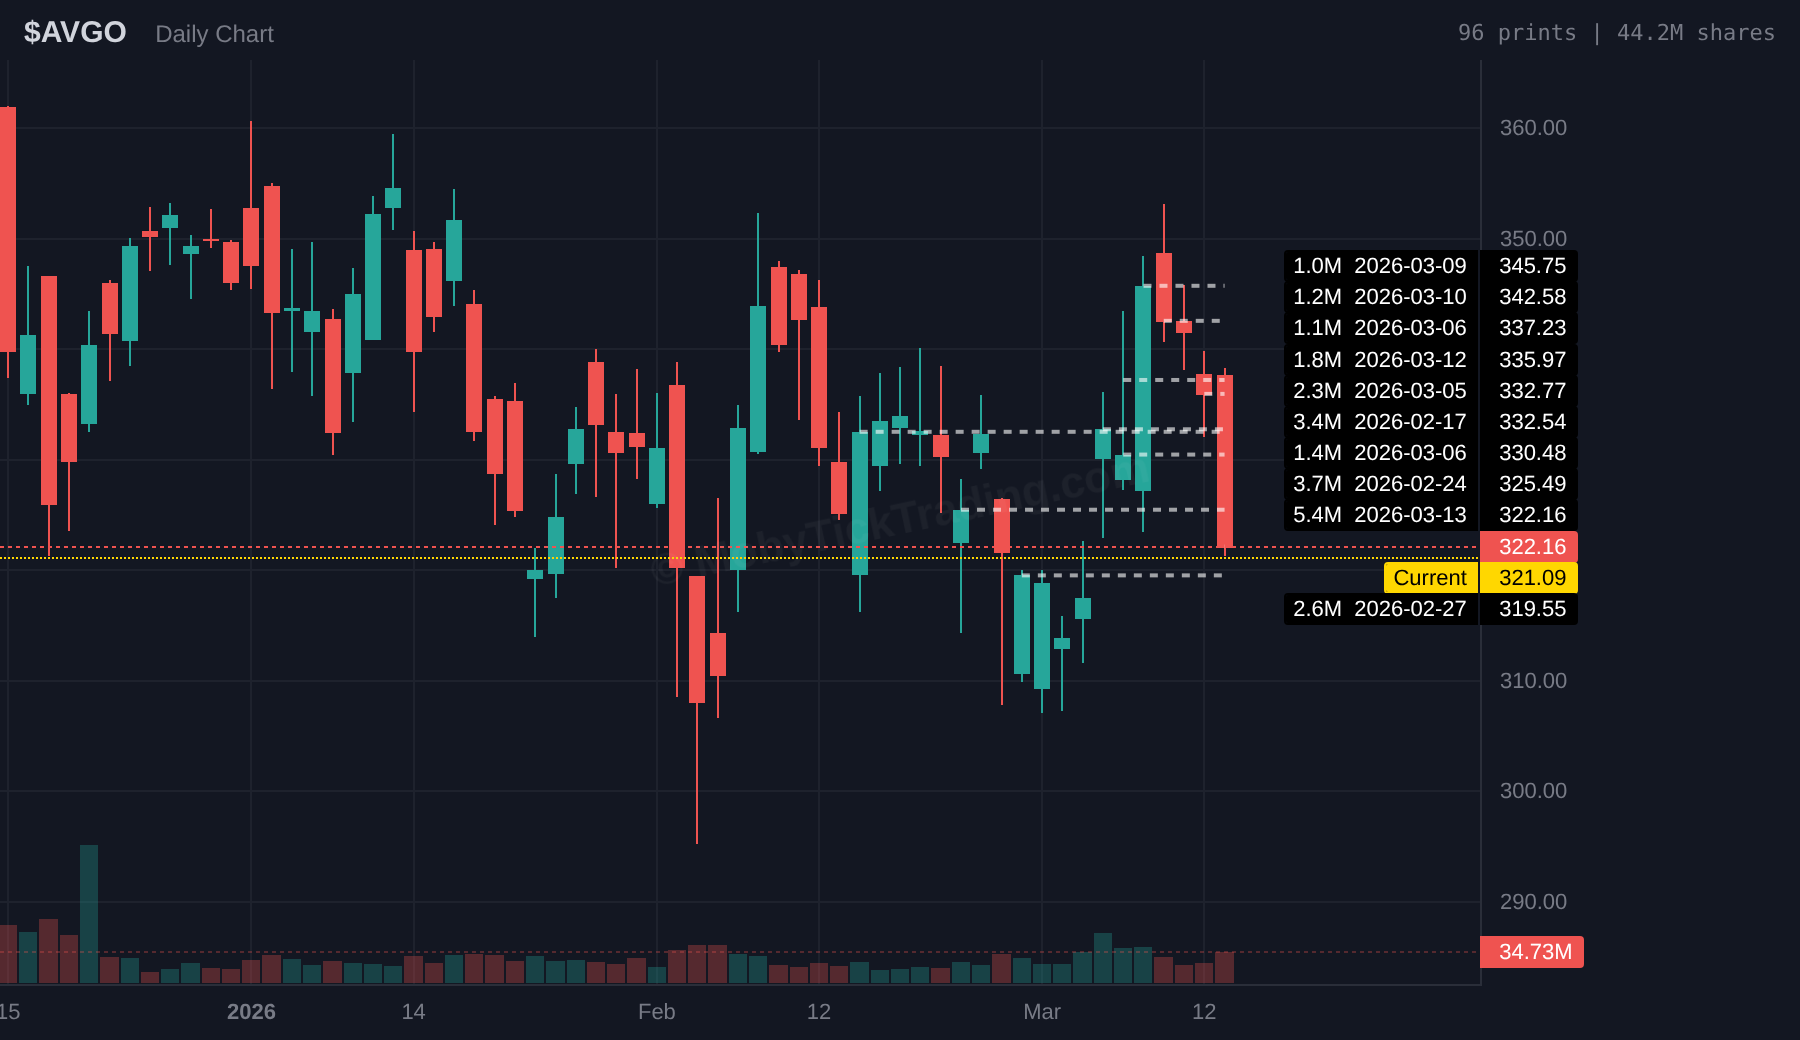
Current: $321.09. Broadcom saw a monster $1.73 billion print (5.4M shares at $322.16). Current price sits right at this institutional level. Higher prints at $325–$345 from February represent overhead supply.
BA — Defense Contractor Repositioning
Current: $209.26. Prints moved steadily lower: $243 (Feb 13) → $233 (Feb 20) → $222 (Mar 5) → $208 (Mar 13). Part of the IDEF defense rotation story.
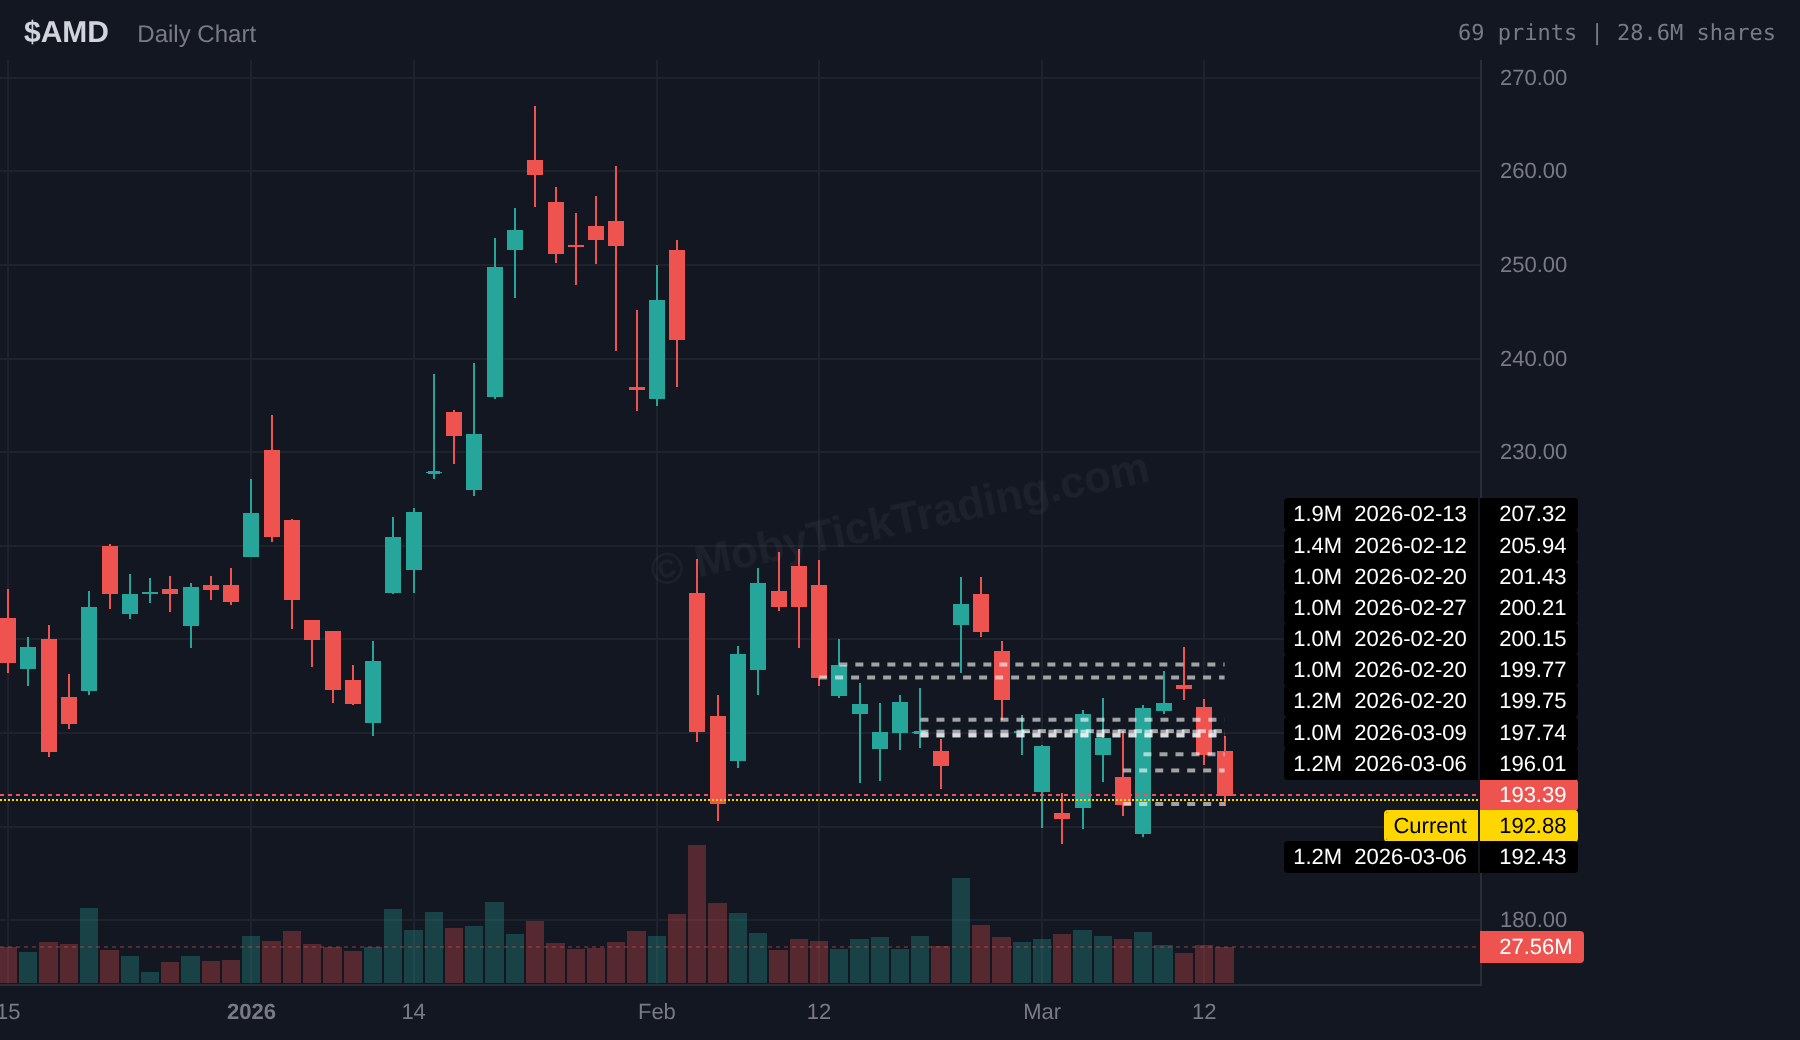
AMD — Semiconductor Under Pressure
Current: $192.88. $5 billion in 60-day dark pool prints. Heaviest prints at $205–$207. A print cluster at $192–$197 could provide support.
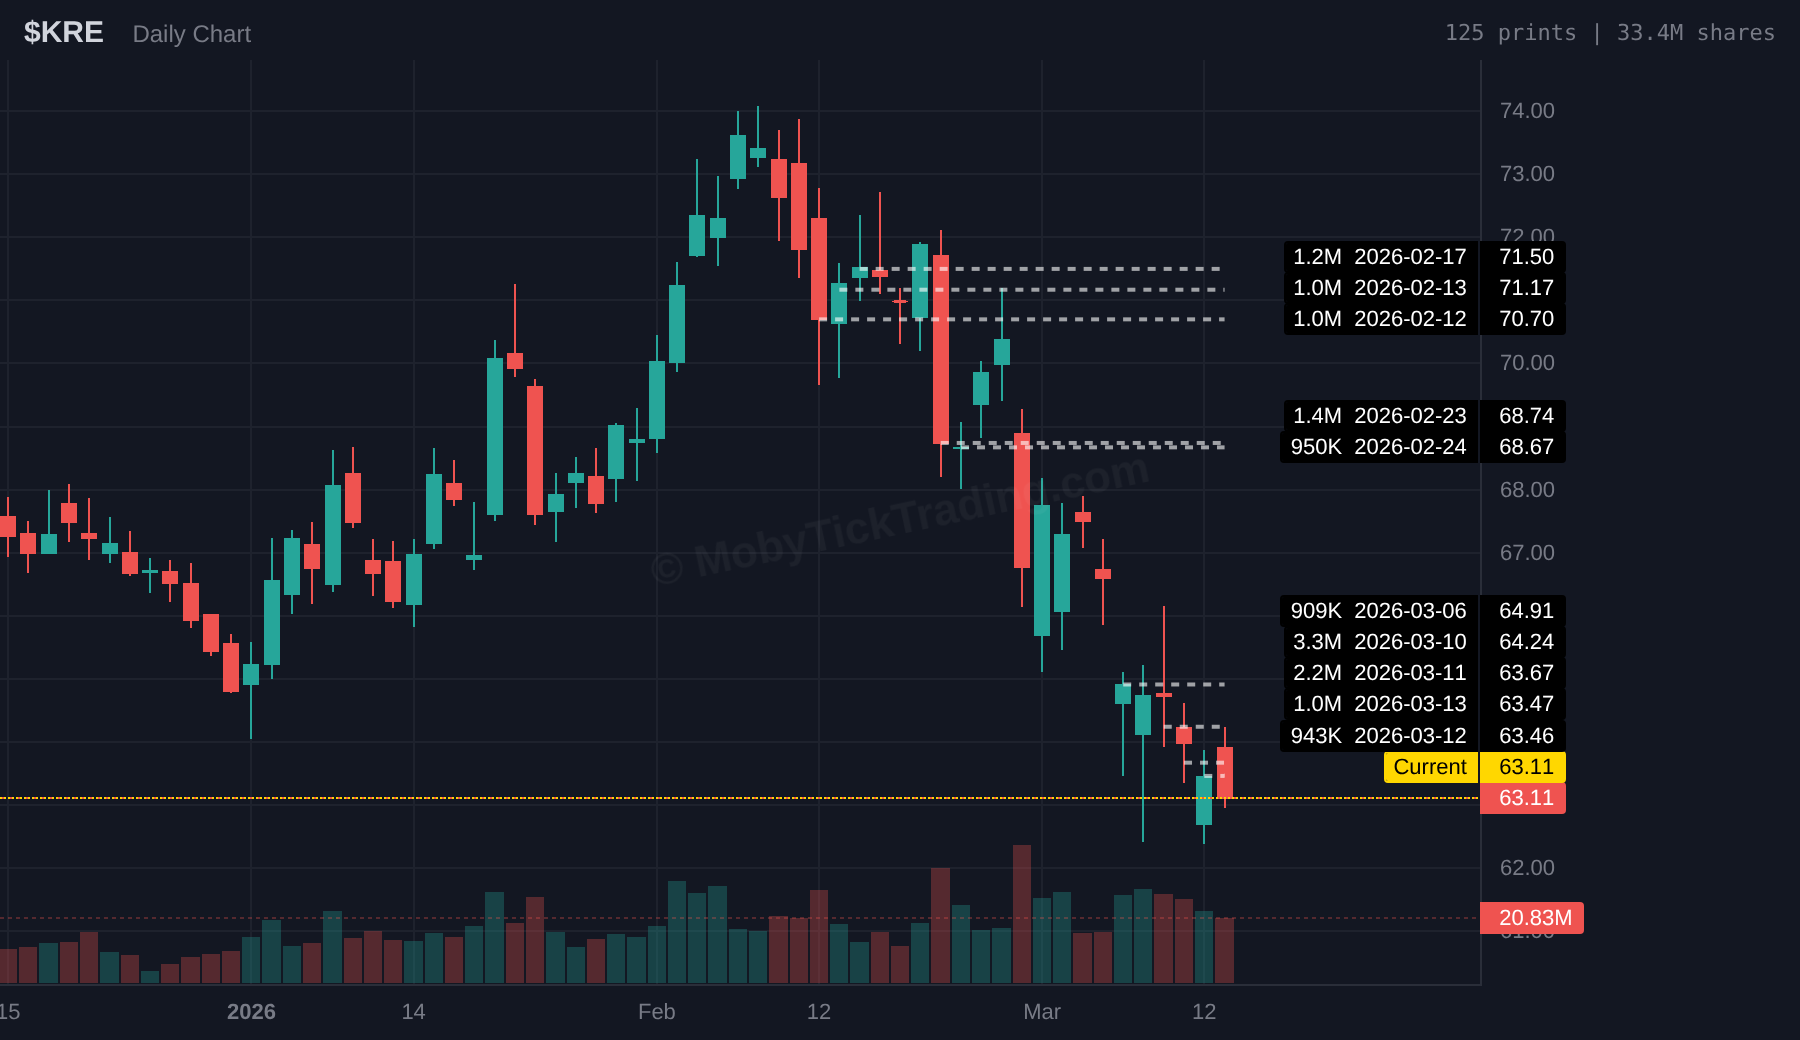
KRE — Regional Banks Under Stress
Current: $63.11. Prints show a steady decline: $71.50 (Feb 17) → $68.74 (Feb 23) → $64.24 (Mar 10) → $63.47 (Mar 13). Downward staircase.
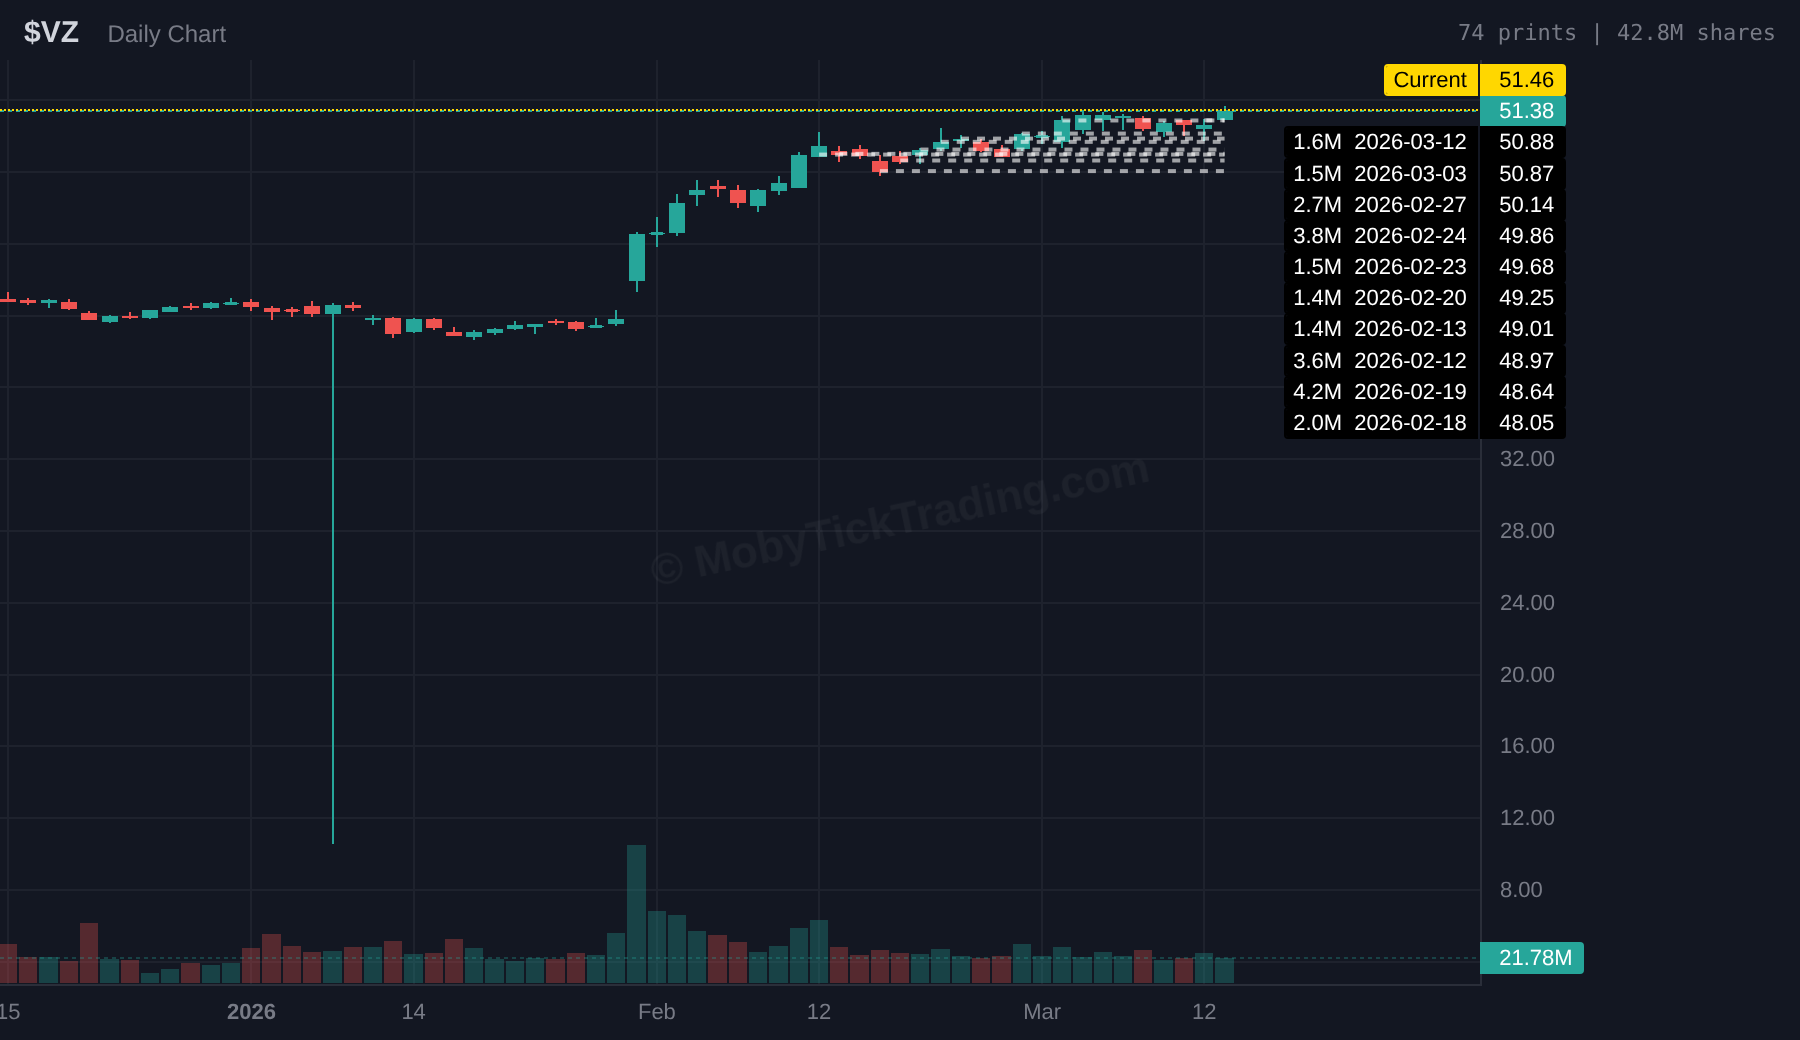
VZ — Defensive Flight to Yield
Current: $51.46. Classic flight-to-safety. Prints climbed: $48.05 (Feb 18) → $49.86 (Feb 24) → $50.88 (Mar 12). Institutions accumulated $48–$50, now in profit.
📚 Sector Rotation in Real Time
This week provided a textbook example of sector rotation — and dark pool data let us see it happen in real time.
What Is Sector Rotation? Sector rotation is when institutional capital moves from one sector to another based on changing economic conditions, geopolitical events, or market cycles. It’s not that money leaves the market — it shifts. Dark pool data shows us WHERE that money is going before the headlines catch up.
On March 12, the Iran tanker strikes sent shockwaves through markets. Look at what the dark pool data showed that same day:
- IDEF (Defense ETF): 43.9 million shares — $1.55 billion
- ITA (Aerospace & Defense): 4.3 million shares — $992 million
- XOM (Exxon): 4.5 million shares — $689 million
- SPY (S&P 500): 7.6 million shares at $666.18 — price falling
The capital wasn’t leaving the market. It was rotating — in real time, visible through dark pool data.
How to Read Sector Rotation
- Compare print sizes: When one sector’s prints spike while another’s drop, money is moving.
- Watch print prices: Rising = buying higher. Falling = repositioning lower.
- Look for outliers: IDEF went from 755K shares to 43.9M in one day. That’s conviction.
- Check timing: Prints on the SAME DAY as a catalyst = institutions acting immediately.
The Key Takeaway: Institutions don’t panic — they rotate. They move capital from sectors that will be hurt to sectors that will benefit. Dark pool data lets you see this before it shows up in headlines.
📩 Get This Report Every Sunday
This weekly report is completely free. Subscribe at mobyticktrading.com/weekly-report to get institutional dark pool levels, trade setups, and educational content every Sunday before the market opens.
About MobyTick Trading
MobyTick Trading provides institutional-grade dark pool and block trade intelligence to retail traders. Charts show you the past — MobyTick shows you what institutions are doing RIGHT NOW.
- 10,000+ stocks tracked in real-time
- 5+ years of historical dark pool data
- 91% accuracy rate on trade callouts
- Heatmaps, scanners, alerts, and more
This newsletter is for educational and informational purposes only. It does not constitute financial advice, investment recommendations, or a solicitation to buy or sell any securities. Dark pool data represents historical trades and does not predict future price movements. Always do your own research and consult with a qualified financial advisor before making investment decisions. Past performance is not indicative of future results.