Physical Address
304 North Cardinal St.
Dorchester Center, MA 02124
Physical Address
304 North Cardinal St.
Dorchester Center, MA 02124

13 trade setups for August 3-7 2026. Dark pool intelligence from July 27–31.
The Fed said no, and the tape took two days to get over it.
Every index closed green: S&P 500 7,489.72 (+1.05%), Nasdaq Composite 25,373.85 (+1.59%), Dow 52,485.03 (+1.04%), Russell 2000 2,931.34 (+0.05%). But the weekly numbers hide the shape. Wednesday’s FOMC day was the low close of the week for all four. From that Wednesday close, the S&P added +2.37% in two sessions, the Nasdaq +3.81%, the Dow +1.73%, the Russell +0.86%.
Wednesday, Jul 29: the FOMC held the funds target at 3.50%–3.75% — and three officials dissented, all wanting a hike. First time since September 2016 that three policymakers broke ranks with a unified directional view. Chair Kevin Warsh took the podium after.
The data behind the dissent, both released Thursday: Q2 GDP came in at +1.5% annualized, down from +2.1% in Q1. Core PCE ran +0.1% m/m and +3.3% y/y — still above target, though cooler than May’s 3.40%. Slower growth, sticky prices.
Rates voted with the dissenters. The 10Y closed at 4.75%, up 10bp from Monday’s 4.65%, and the long end followed — TLT −1.20%, 30Y at 5.27%. Friday brought more public hike calls from Fed officials and another leg up in yields.
Volatility did the opposite. VIX spiked to 20.66 on FOMC day, then collapsed to 15.99 by Friday — a 13.94% drop on the week and the week’s low print.
Not from breadth. SPY +1.10% against QQQ +0.55% and IWM +0.01%. Small caps went nowhere. Semis went backwards — SMH −3.68% while broad tech XLK sat near flat at −0.30%. Financials led the listed sector ETFs at XLF +1.12%; materials lagged at XLB −1.62%. Energy sat out — XLE −0.12%, USO −5.50% despite Friday’s WTI settle at $84.67.
The dispersion inside mega-cap tech was the real story. MSFT +21.75% and GOOGL +11.38% on earnings, against AAPL −7.24% and NVDA −2.94%. That’s a 29-point spread between the best and worst mega-cap on our board in a single week. Index-level gains were concentrated, not broad.
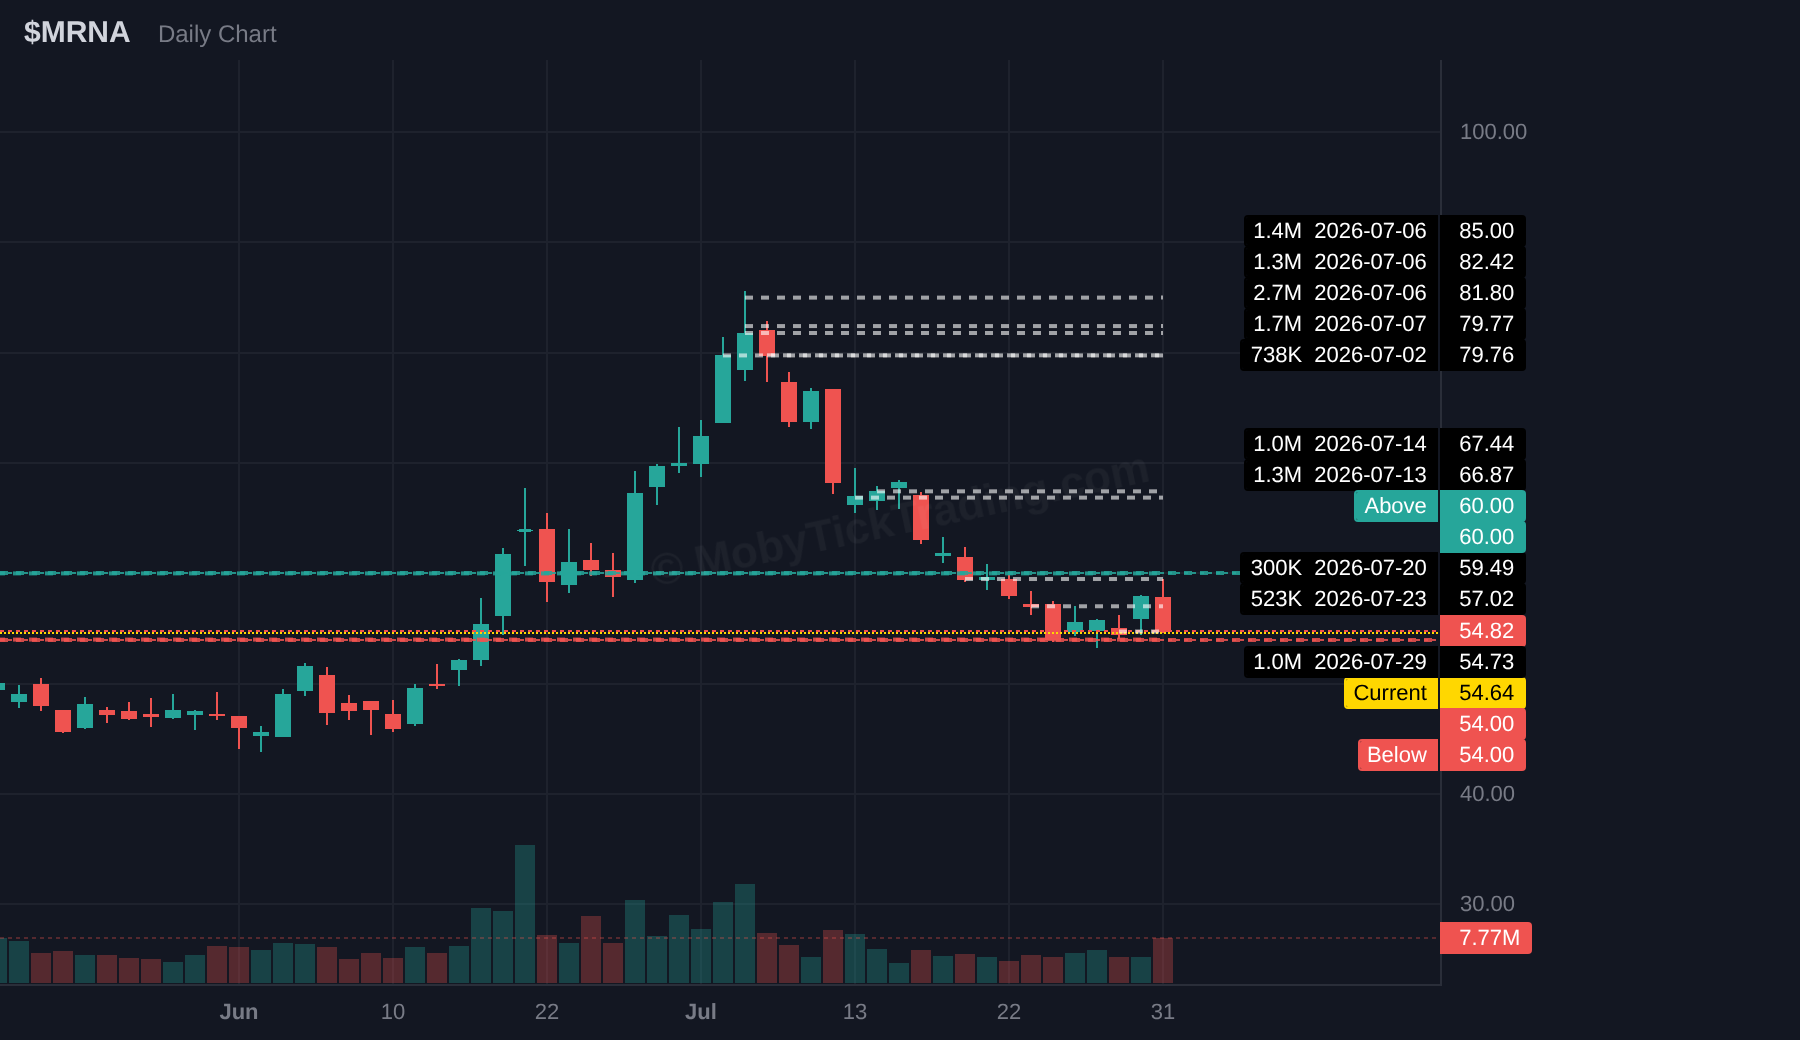
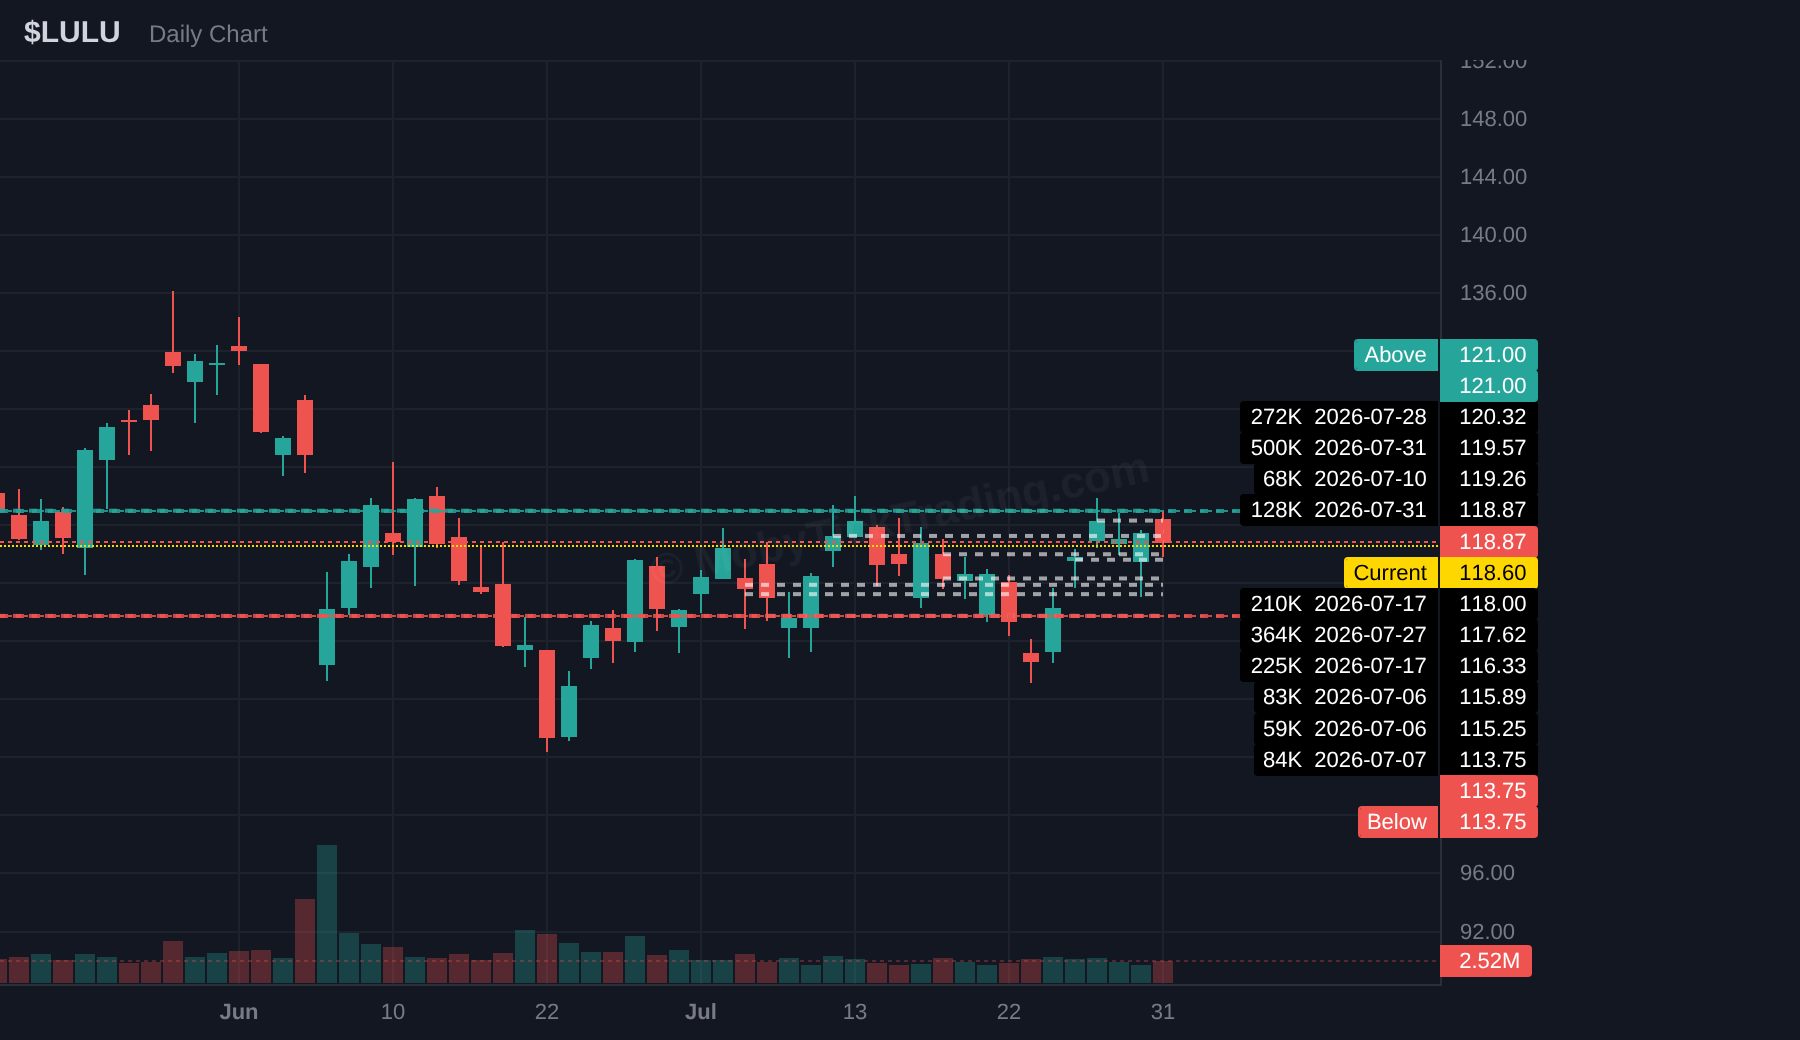
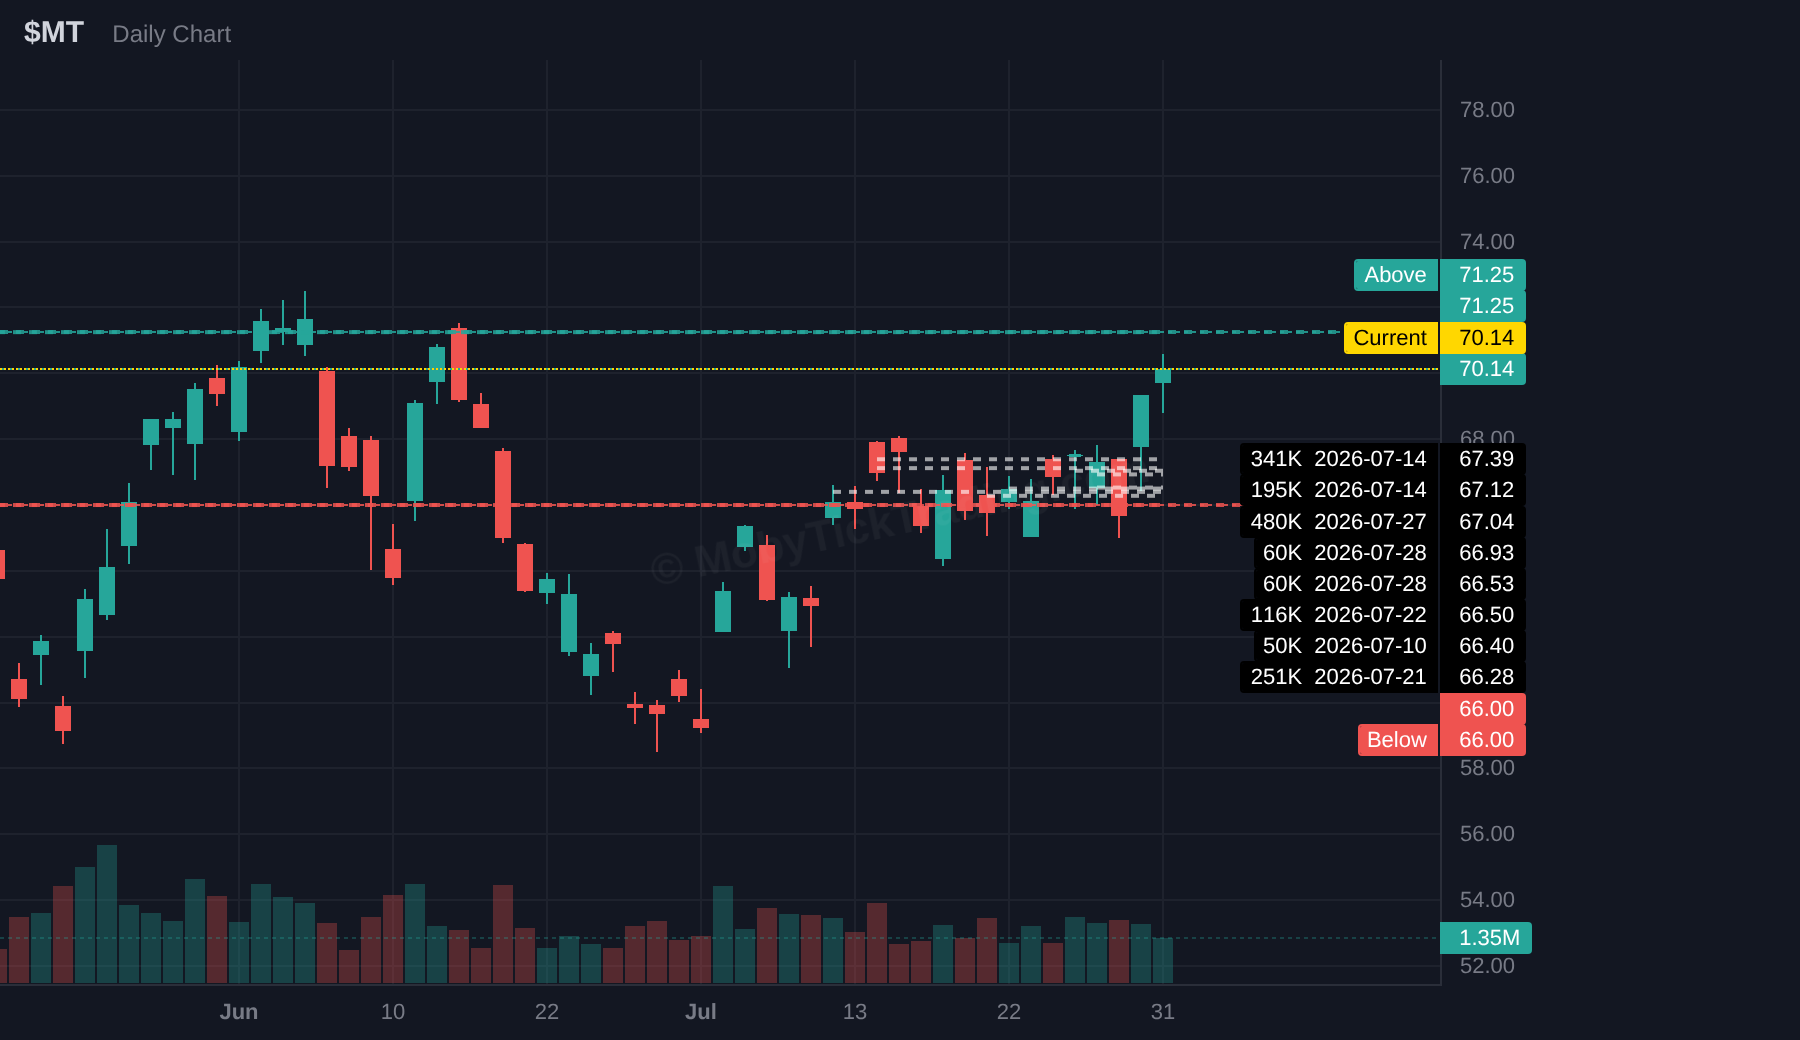
Elsewhere on the tape: ITRI +18.33%, OWL +8.99%, MT +4.87%, LULU +4.02%, MRNA +1.39%, RIVN −3.91%.
740 qualifying prints logged for the week. The broad-market ETF complex — SPY, QQQ, IWM, VOO, IVV — absorbed $25.48B, roughly 9x the $2.81B through all eleven sector SPDRs combined. XLF topped the sectors at $1.31B on 21 prints, the heaviest print count of any sector fund, at 0.7x volume. XLB drew zero.
Among our names on the full weekly tape, SPY led at $48.67B across 67 prints (0.4x ADV), QQQ at $34.19B on 117 prints, then the single-stock leaders: AAPL at $10.36B on 42 prints (0.3x), NVDA at $8.90B on 74 prints, MSFT at $6.96B on 53 prints, GOOGL at $2.41B on 20 prints, and IWM at $3.26B on 59 prints. Note the split: AAPL took the heaviest single-stock flow on our board and closed the week down 7.24%.
All 13 tickers reached at least one profit target — 7 Above levels triggered, 12 Below, none left inactive. 31 total targets hit.
Twelve Below triggers in a week where every index finished higher. That’s what a mid-week FOMC air pocket does to a two-sided book.
*Data sourced from MobyTick.*
| Ticker | Above | Below | High | Low | Close | Triggered | Targets Hit | Move From Trigger |
|---|---|---|---|---|---|---|---|---|
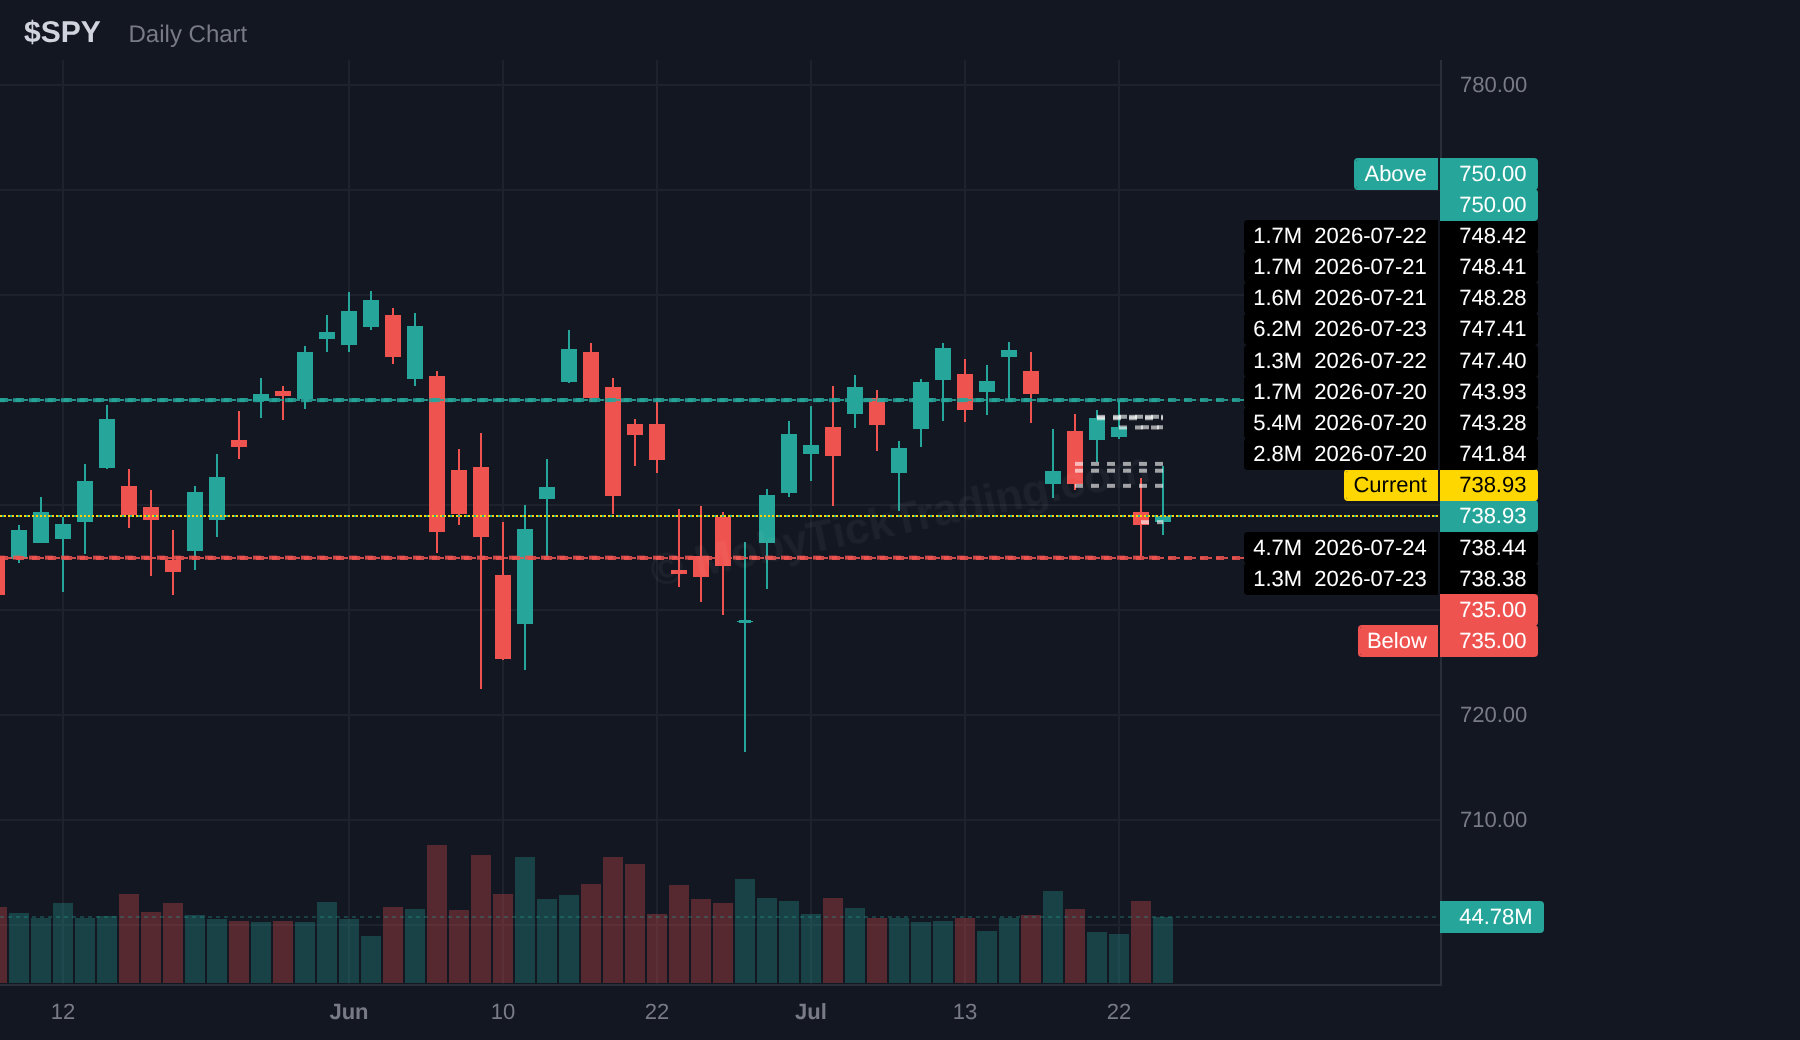
| SPY | $750.00 | $735.00 | $748.90 | $729.10 | $747.03 | Below | 2 of 6 → T2 ($730.00) | $735.00 → $729.10 (−0.80%) |
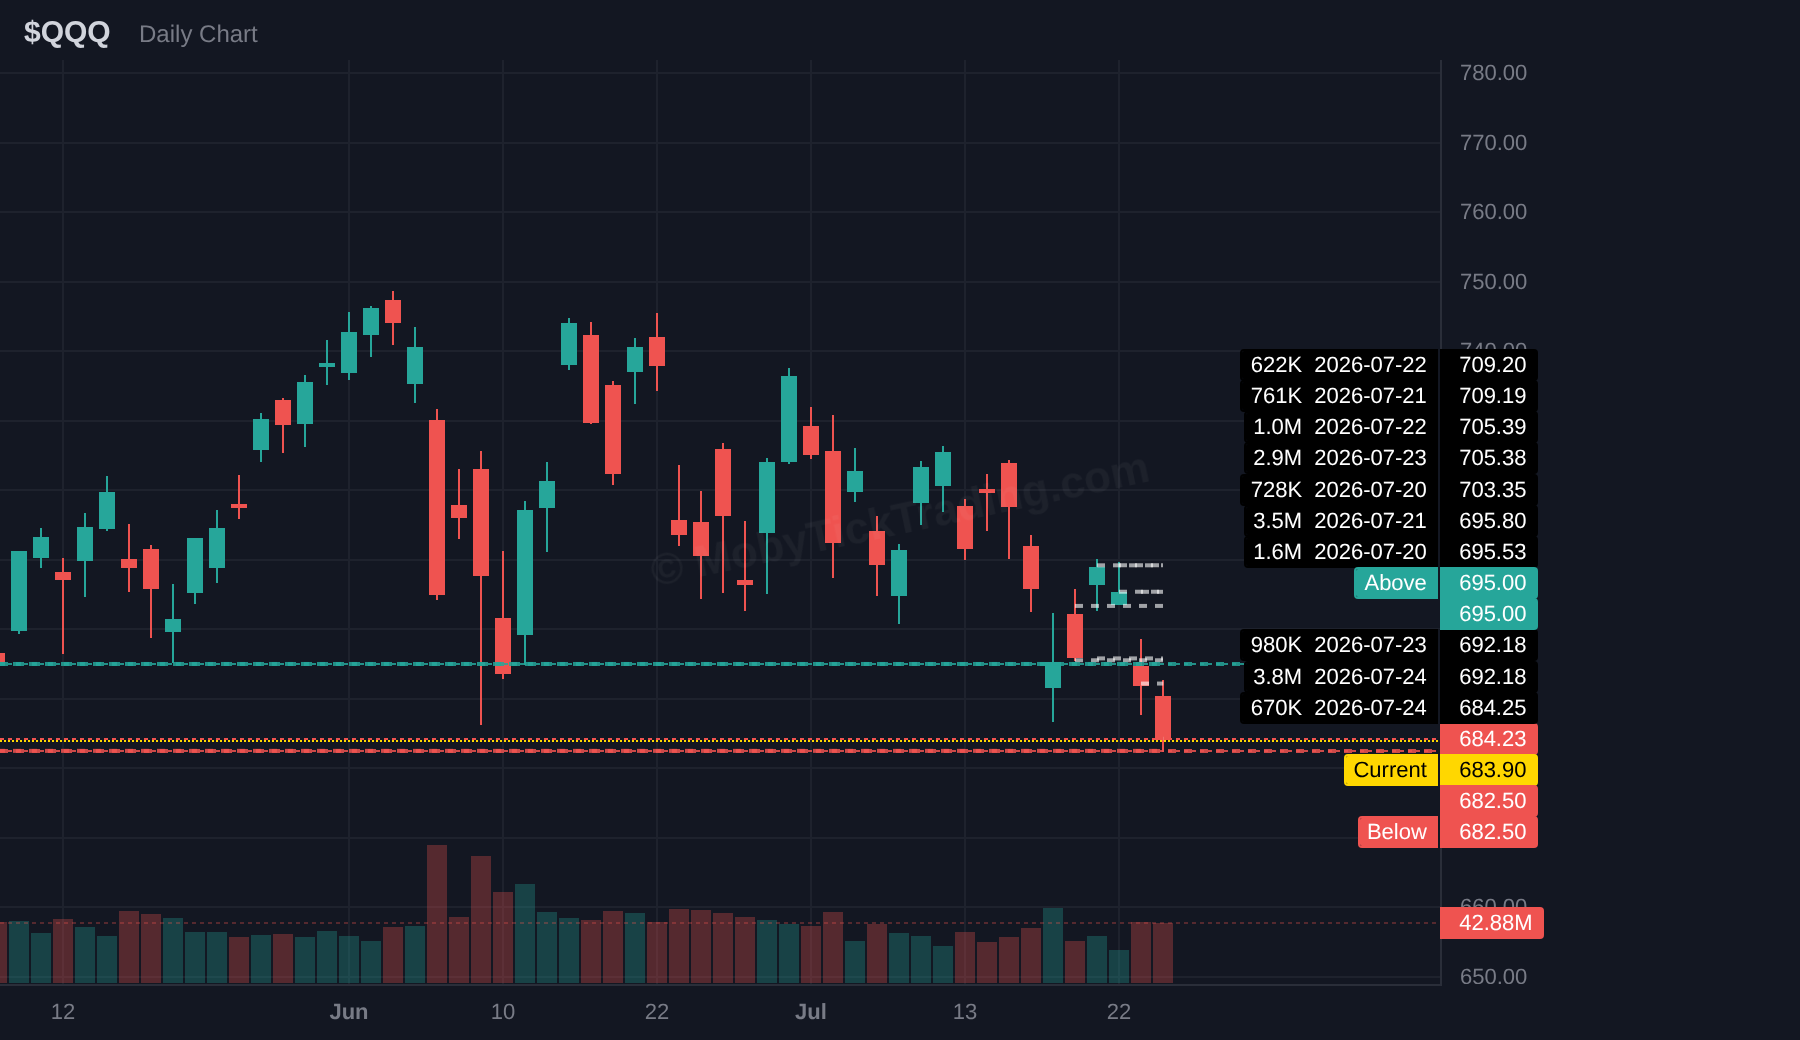
| QQQ | $695.00 | $682.50 | $695.77 | $661.14 | $687.99 | Above + Below | Above: 0 of 6 · Below: 3 of 5 → T3 ($660.00) | Above: $695.00 → $695.77 (+0.11%) · Below: $682.50 → $661.14 (−3.13%) |
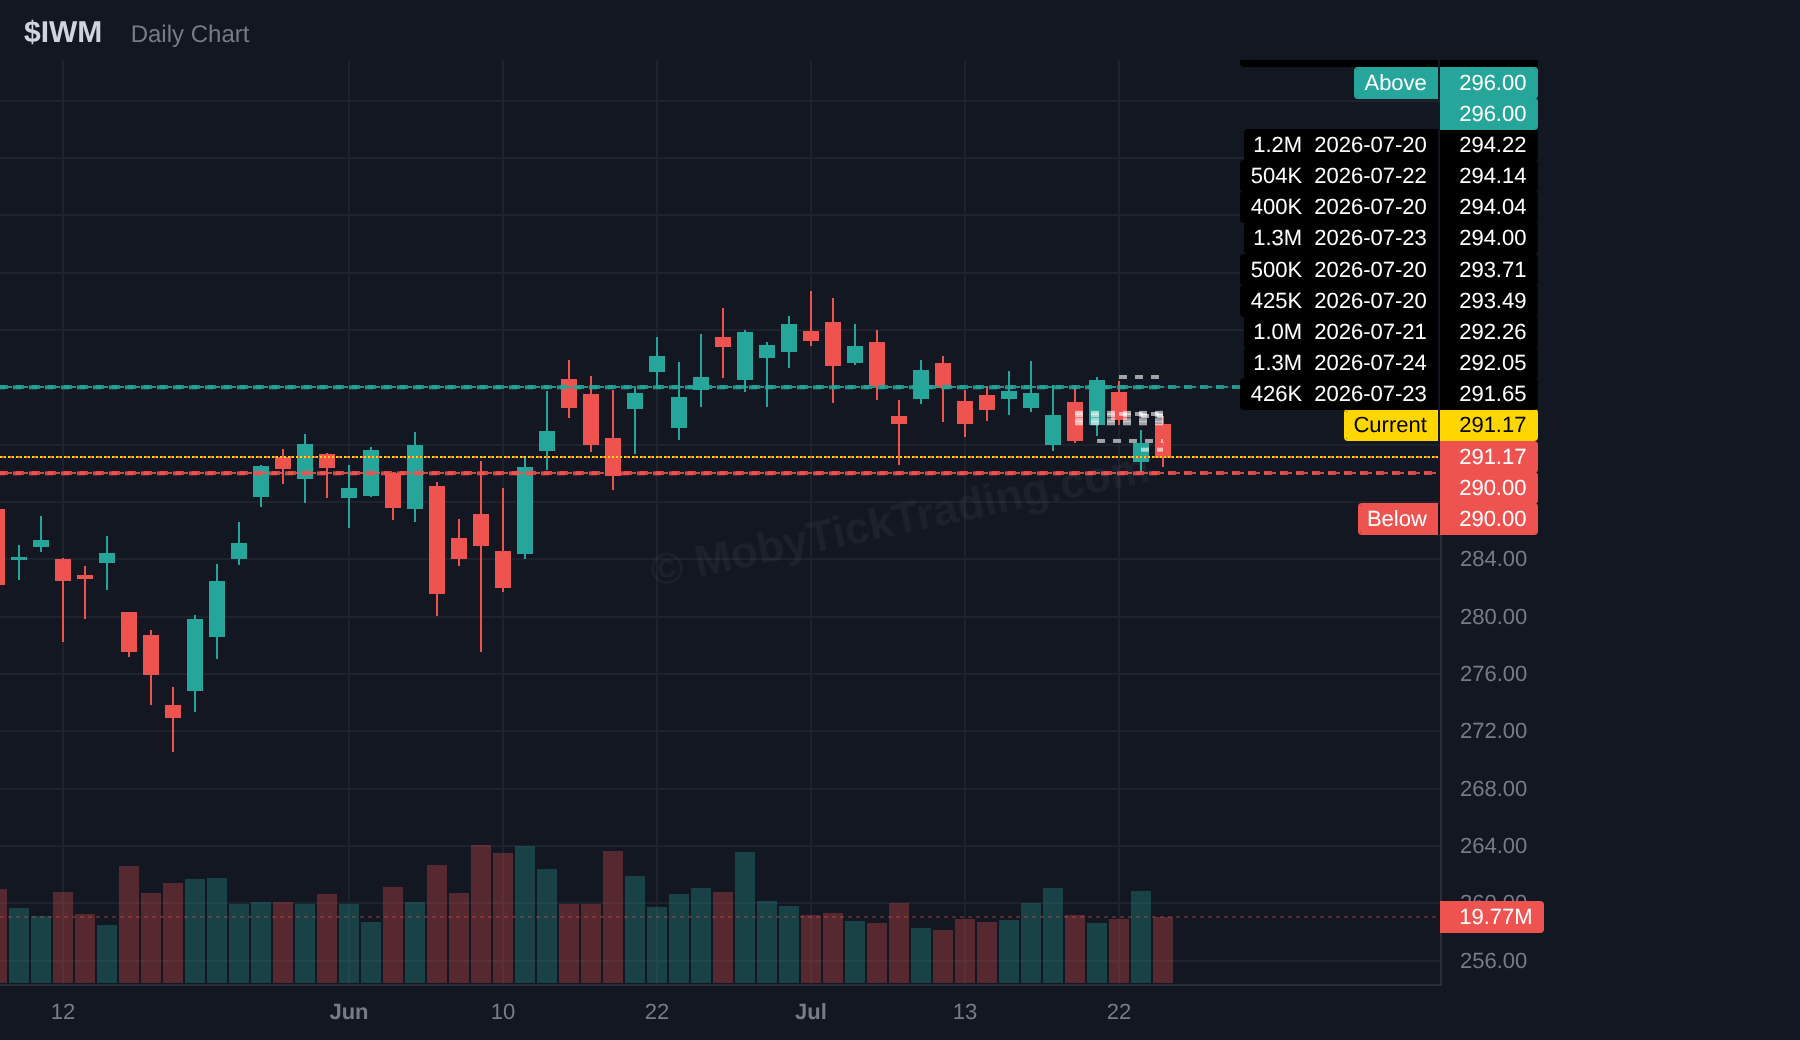
| IWM | $296.00 | $290.00 | $295.52 | $287.83 | $291.20 | Below | 1 of 7 → T1 ($287.50) | $290.00 → $287.83 (−0.75%) |
| XLF 🆕 | $56.50 | $55.00 | $57.60 | $56.18 | $56.94 | Above | 1 of 5 → T1 ($57.50) | $56.50 → $57.60 (+1.95%) |
| AAPL | $334.25 | $319.00 | $344.57 | $300.00 | $308.91 | Above + Below | Above: 3 of 5 → T3 ($342.50) · Below: 4 of 5 → T4 ($300.00) | Above: $334.25 → $344.57 (+3.09%) · Below: $319.00 → $300.00 (−5.96%) |
| AMZN 🆕 | $242.50 | $230.00 | $273.23 | $226.16 | $271.58 | Above + Below | Above: 5 of 5 → T5 ($260.00) · Below: 1 of 5 → T1 ($227.50) | Above: $242.50 → $273.23 (+12.67%) · Below: $230.00 → $226.16 (−1.67%) |
| XOM | $158.50 | $154.00 | $159.07 | $151.88 | $155.44 | Above + Below | Above: 0 of 5 · Below: 1 of 4 → T1 ($152.50) | Above: $158.50 → $159.07 (+0.36%) · Below: $154.00 → $151.88 (−1.38%) |
| TSLA | $325.00 | $310.00 | $317.00 | $297.38 | $311.21 | Below | 1 of 4 → T1 ($300.00) | $310.00 → $297.38 (−4.07%) |
| JPM 🆕 | $355.00 | $349.75 | $359.30 | $343.78 | $351.79 | Above + Below | Above: 0 of 6 · Below: 1 of 6 → T1 ($345.00) | Above: $355.00 → $359.30 (+1.21%) · Below: $349.75 → $343.78 (−1.71%) |
| INTC | $105.00 | $91.00 | $97.90 | $81.79 | $90.20 | Below | 2 of 5 → T2 ($81.00) | $91.00 → $81.79 (−10.12%) |
| EWY 🆕 | $170.00 | $162.50 | $166.04 | $151.13 | $157.10 | Below | 2 of 5 → T2 ($155.00) | $162.50 → $151.13 (−7.00%) |
| HOOD 🆕 | $107.50 | $92.50 | $99.45 | $83.68 | $86.56 | Below | 3 of 6 → T3 ($85.00) | $92.50 → $83.68 (−9.54%) |
| UNH | $430.00 | $420.00 | $431.68 | $411.29 | $414.40 | Above + Below | Above: 0 of 5 · Below: 1 of 7 → T1 ($416.00) | Above: $430.00 → $431.68 (+0.39%) · Below: $420.00 → $411.29 (−2.07%) |
| Ticker | Above Trigger | Targets |
|---|---|---|
| SPY | $755.00 | $757.50 → $760.00 → $765.00 → $770.00 → $775.00 |
| QQQ | $696.00 | $700.00 → $705.00 → $710.00 → $715.00 → $720.00 → $722.50 → $730.00 |
| IWM | $297.00 | $300.00 → $302.50 → $305.00 → $310.00 → $312.50 → $315.00 |
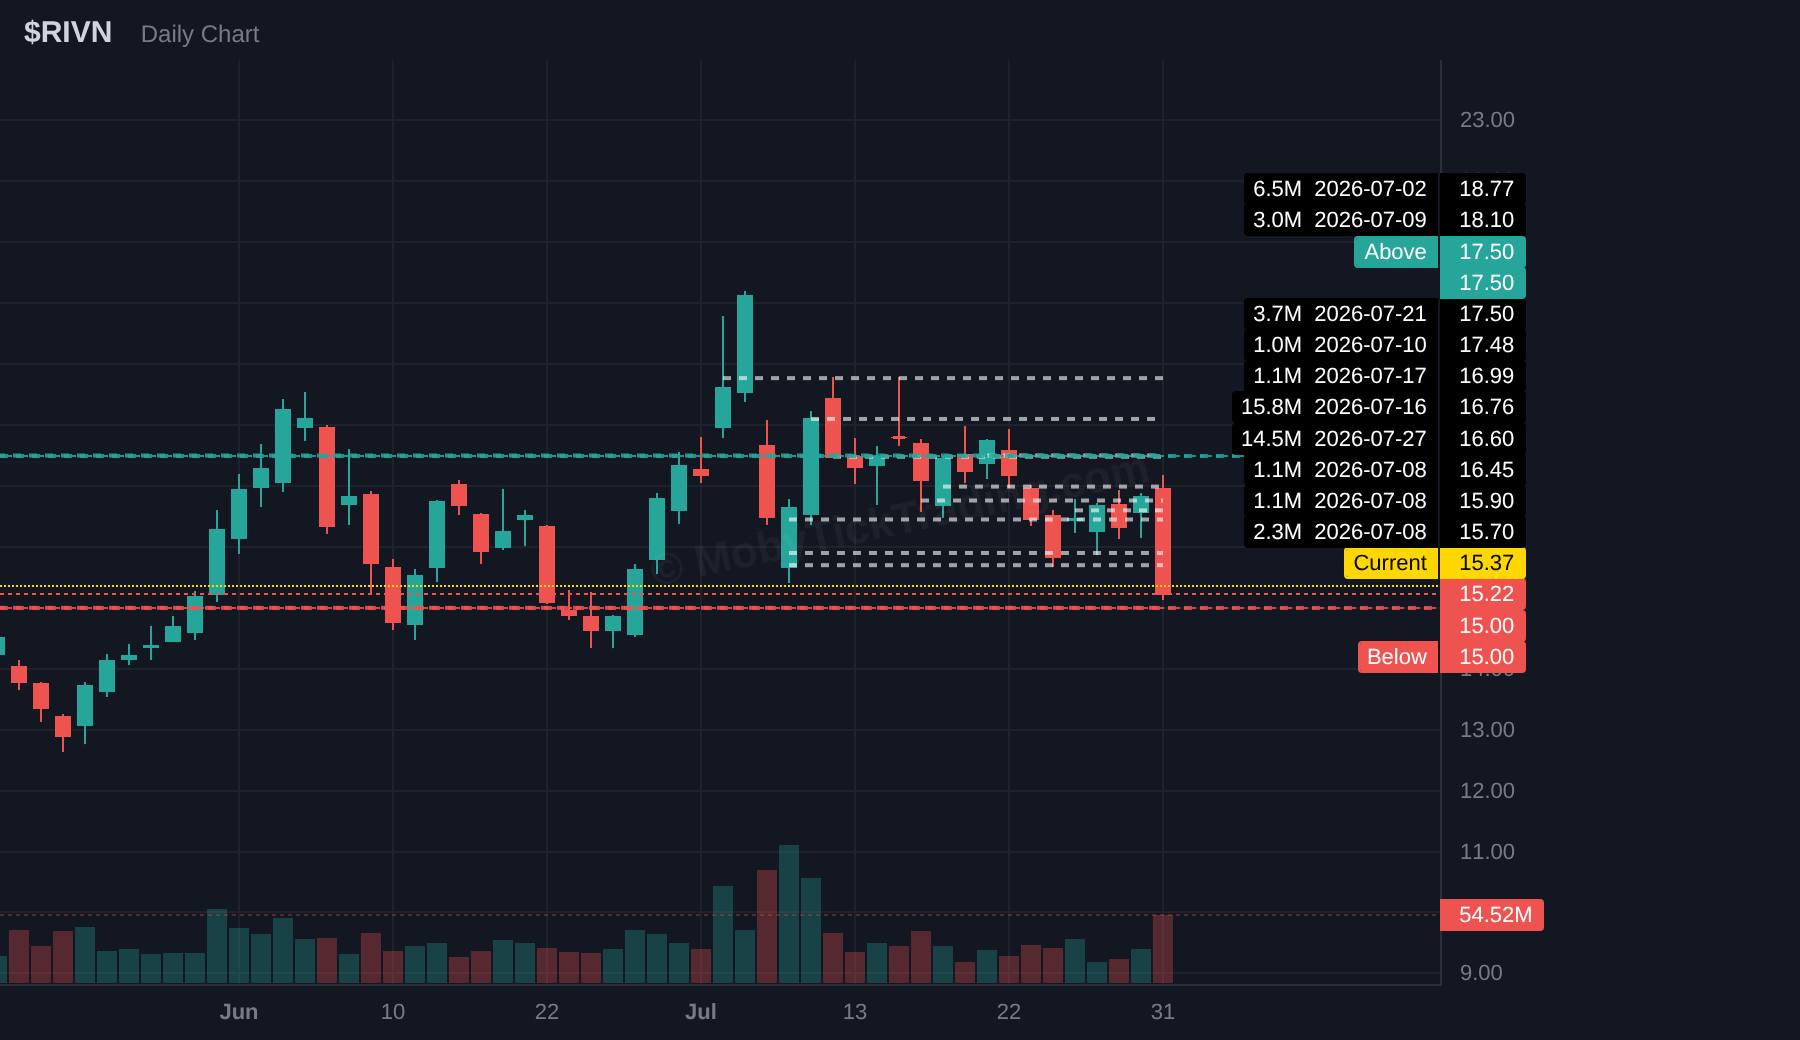
| RIVN | $17.50 | $18.00 → $18.50 → $19.00 → $20.00 → $21.00 → $22.50 |
| MRNA | $60.00 | $62.50 → $65.00 → $67.50 → $70.00 → $72.50 → $75.00 |
| LULU | $121.00 | $122.50 → $125.00 → $127.50 → $130.00 → $132.50 → $135.00 |
| MT | $71.25 | $72.50 → $75.00 → $77.50 → $80.00 |
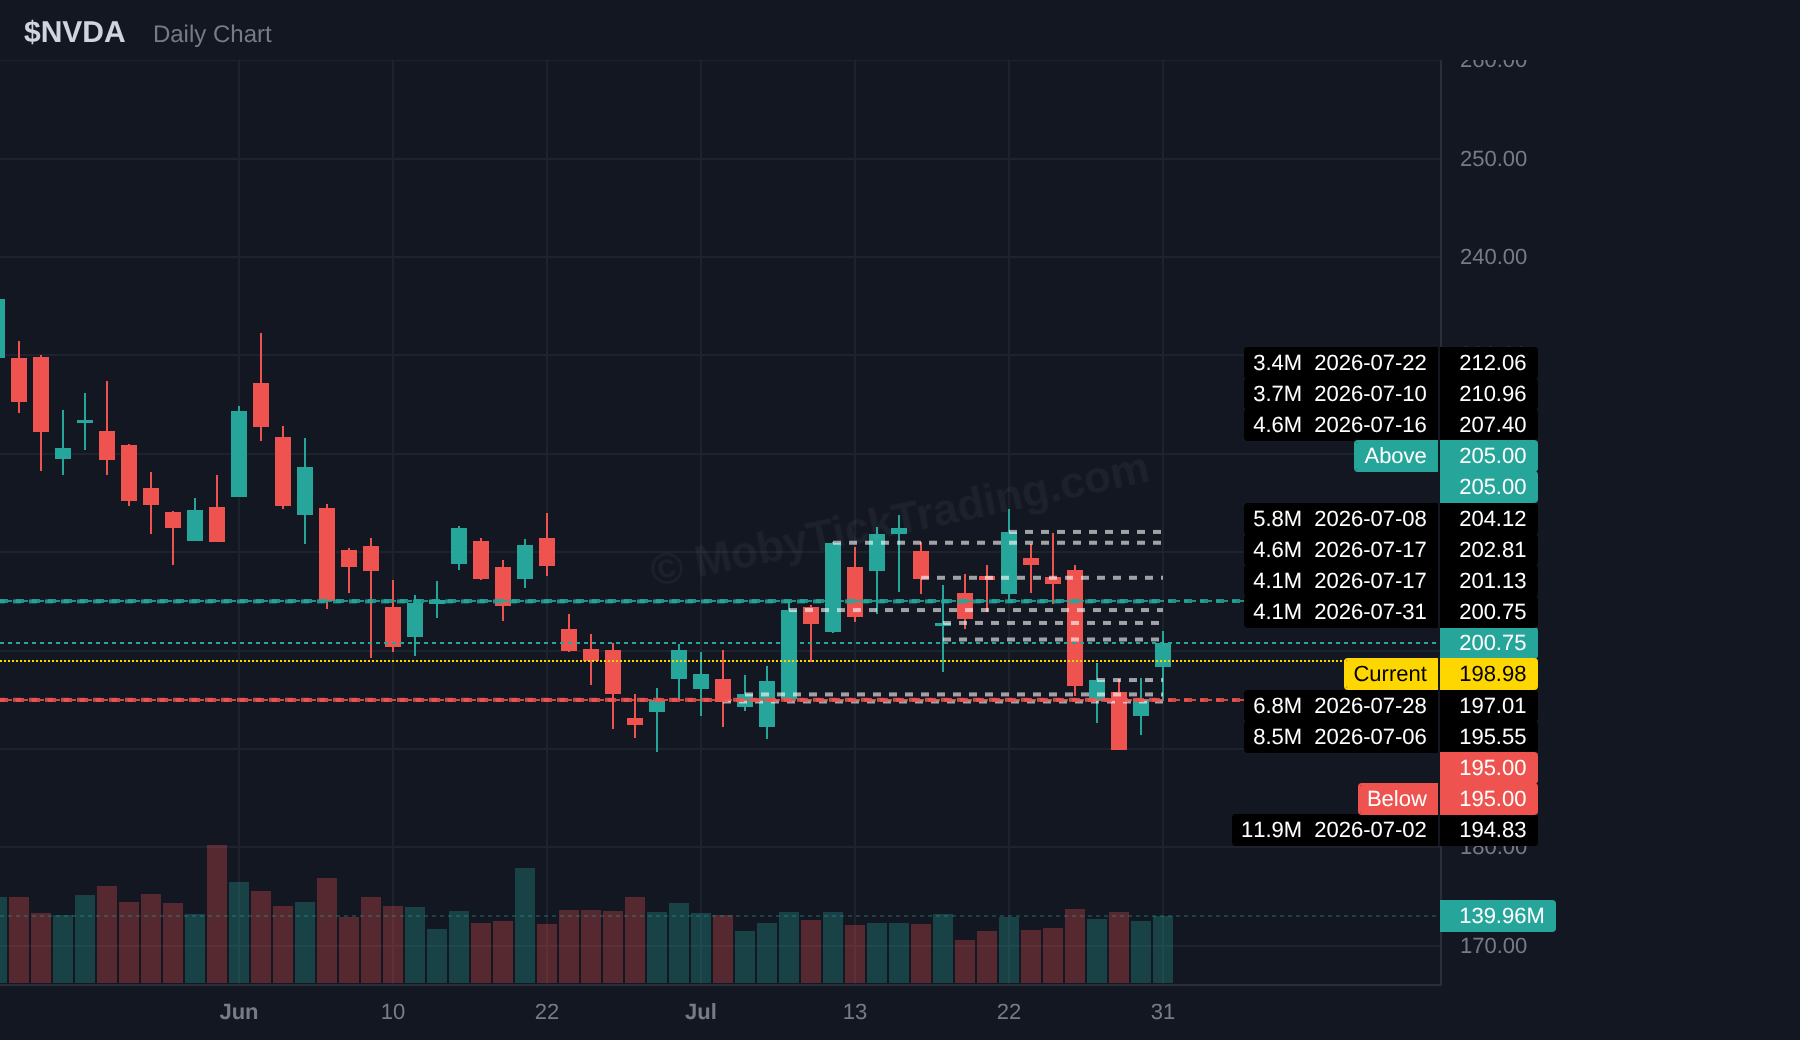
| NVDA | $205.00 | $207.50 → $210.00 → $212.50 → $215.00 → $217.50 → $220.00 |
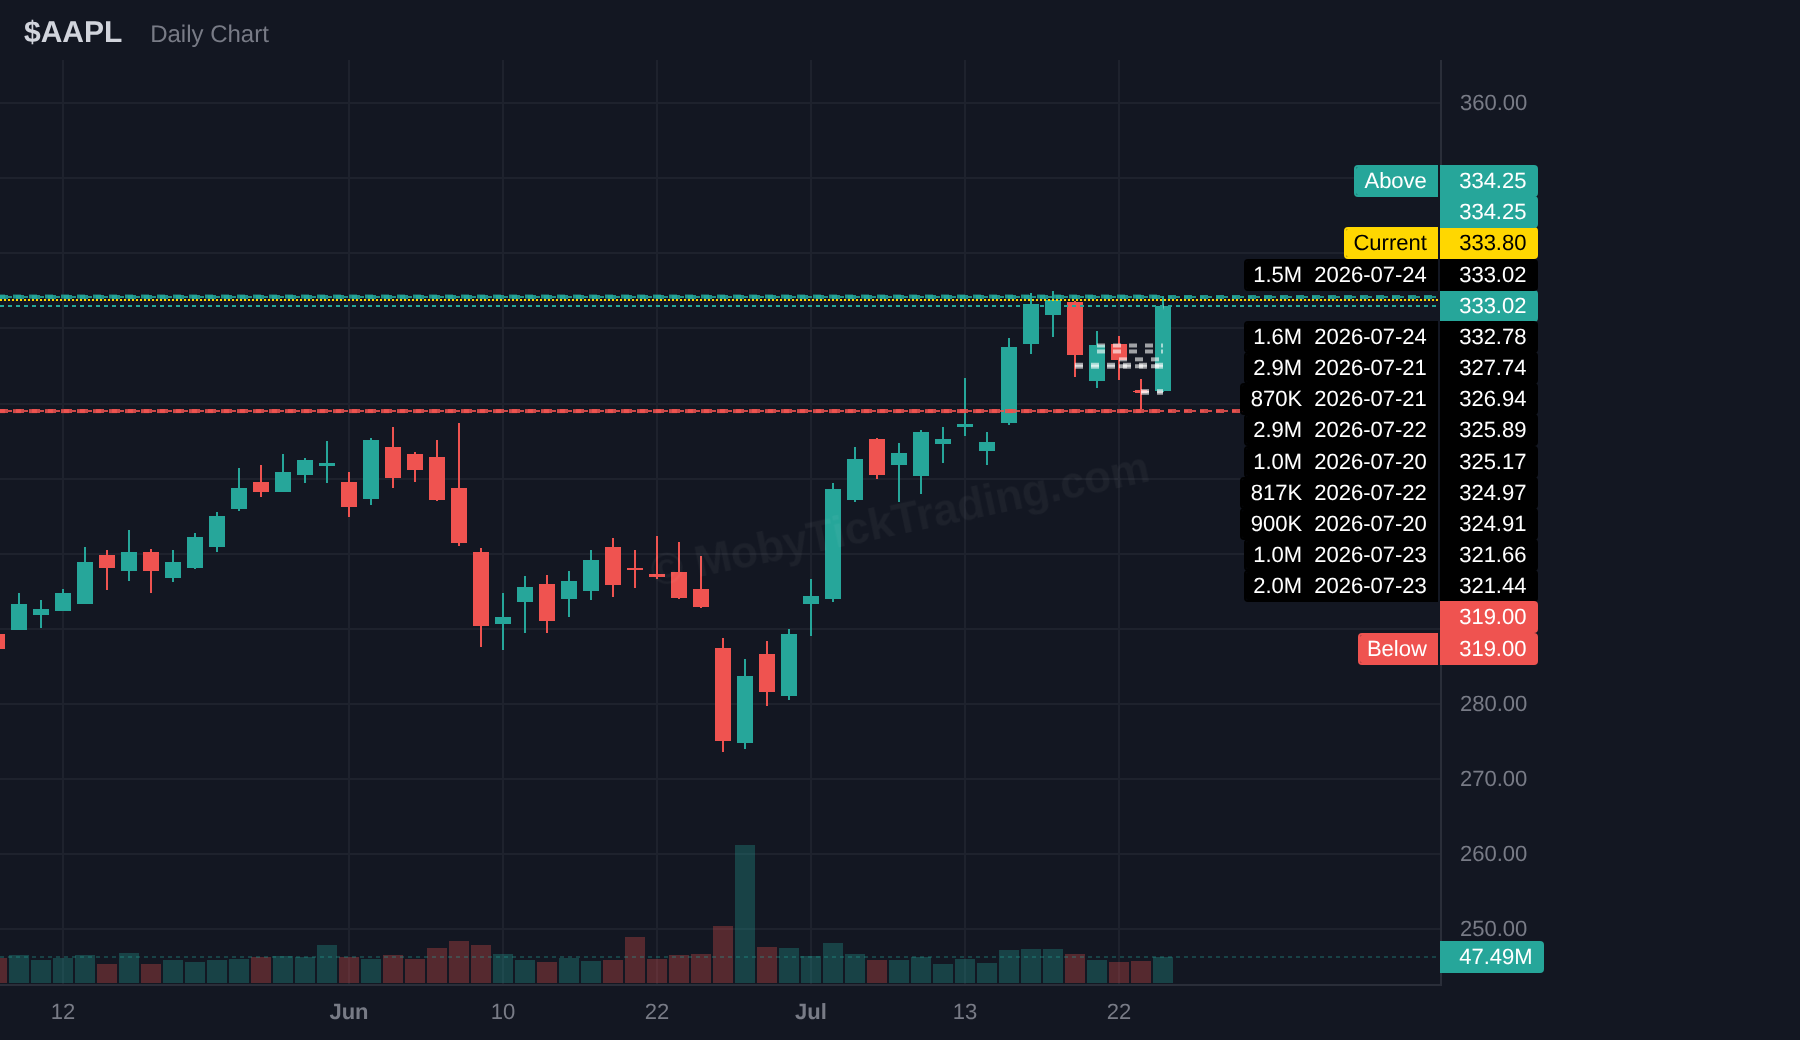
| AAPL | $315.00 | $317.50 → $320.00 → $322.50 → $325.00 → $327.50 → $330.00 |
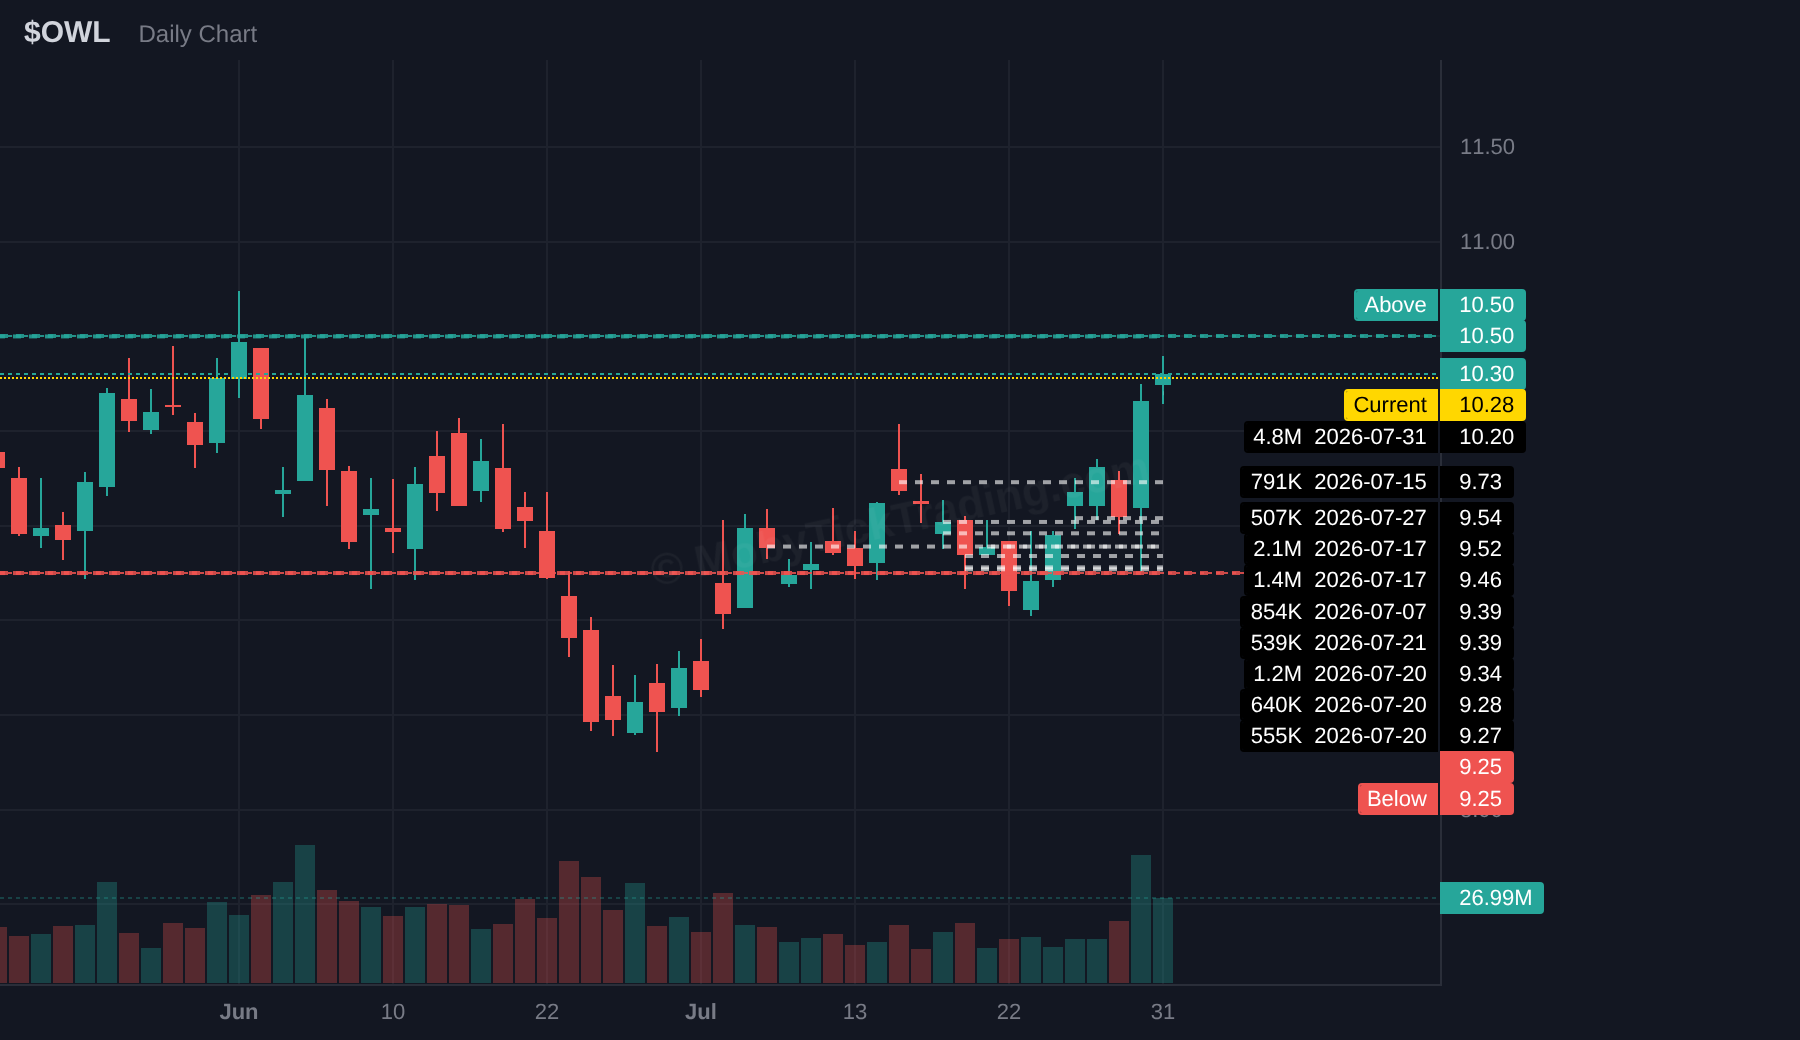
| OWL | $10.50 | $11.00 → $11.50 → $12.00 → $12.50 → $13.00 → $13.75 |
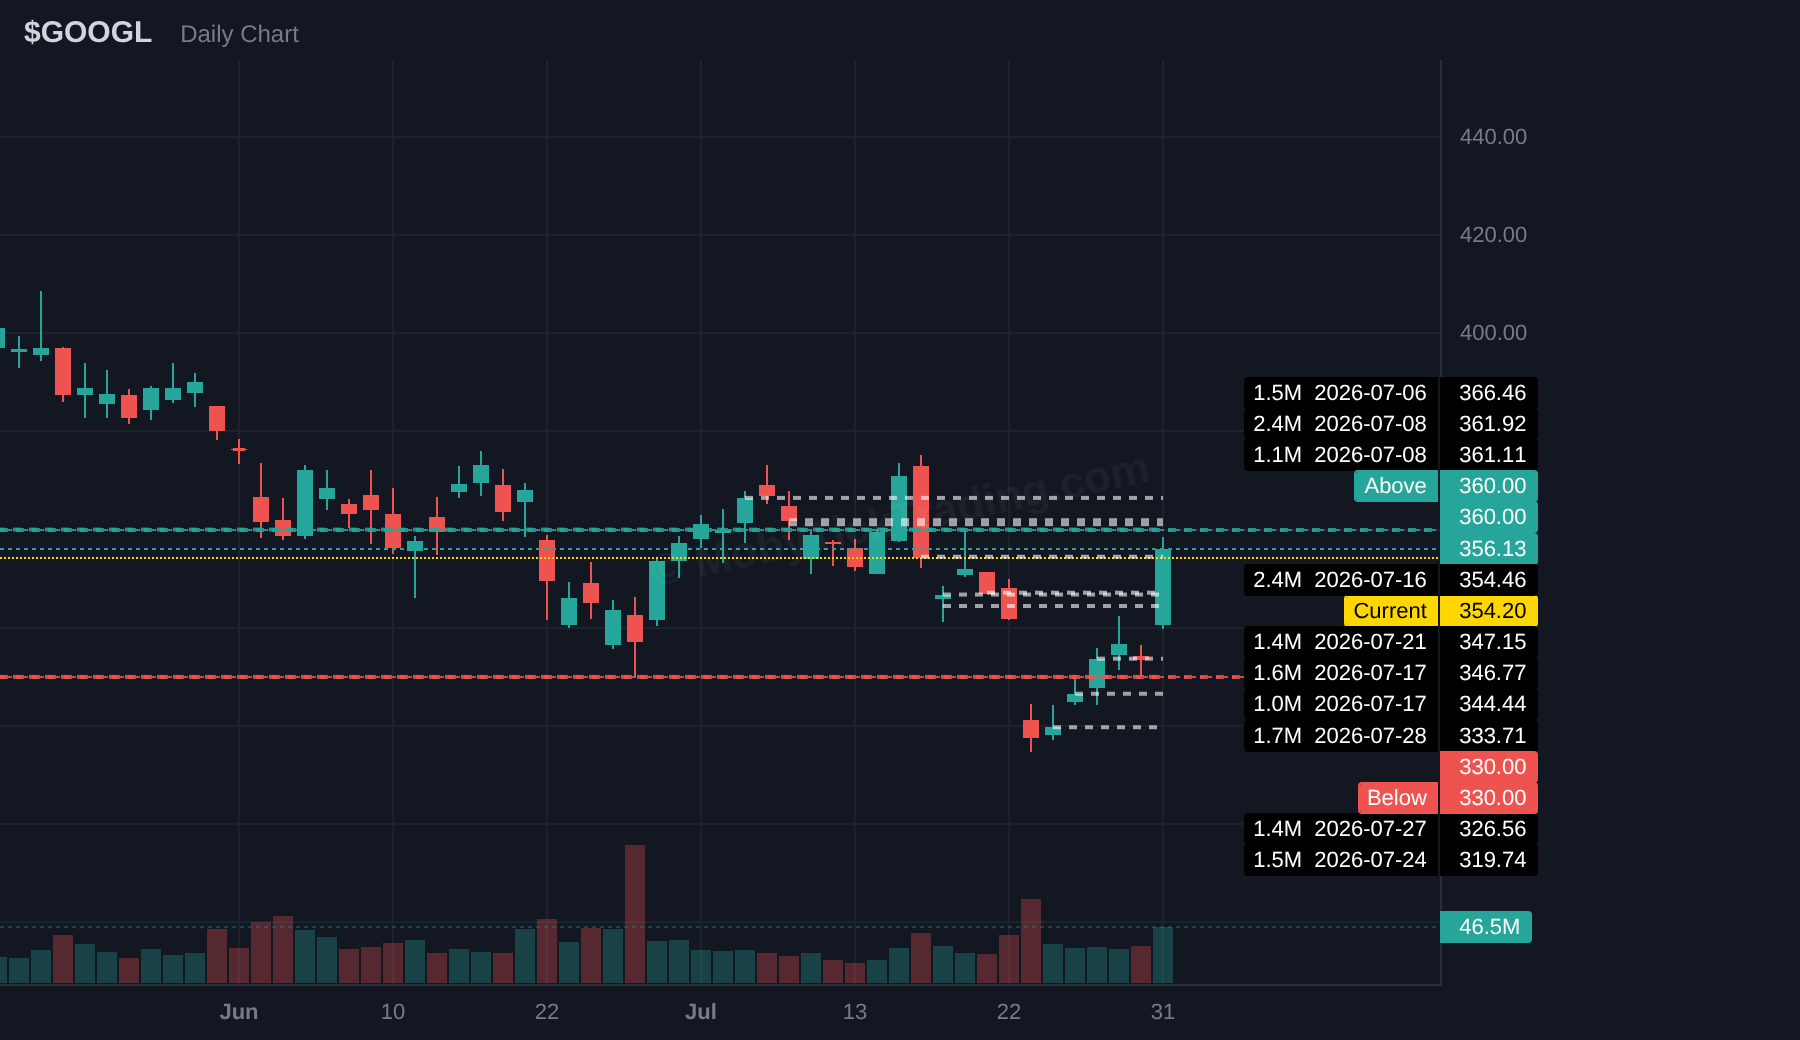
| GOOGL | $360.00 | $365.00 → $370.00 → $375.00 → $380.00 → $387.50 |
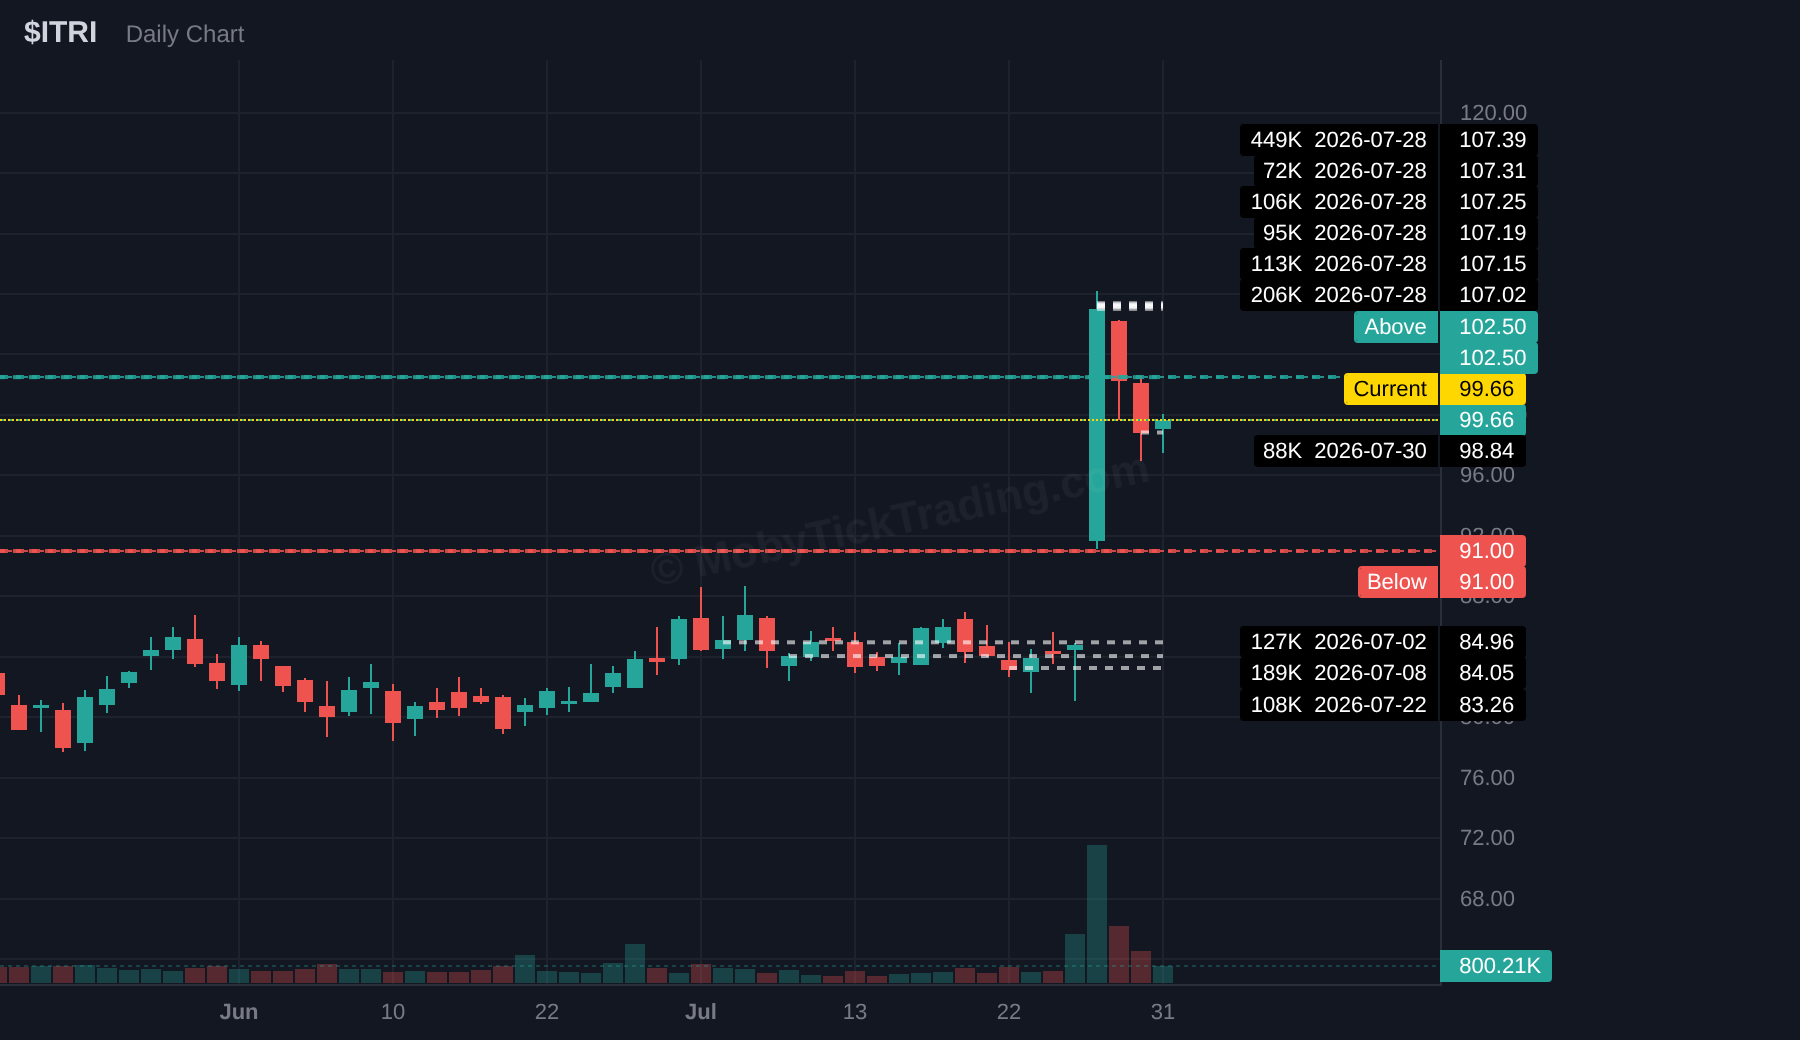
| ITRI | $102.50 | $105.00 → $107.00 → $110.00 → $112.50 → $115.00 |
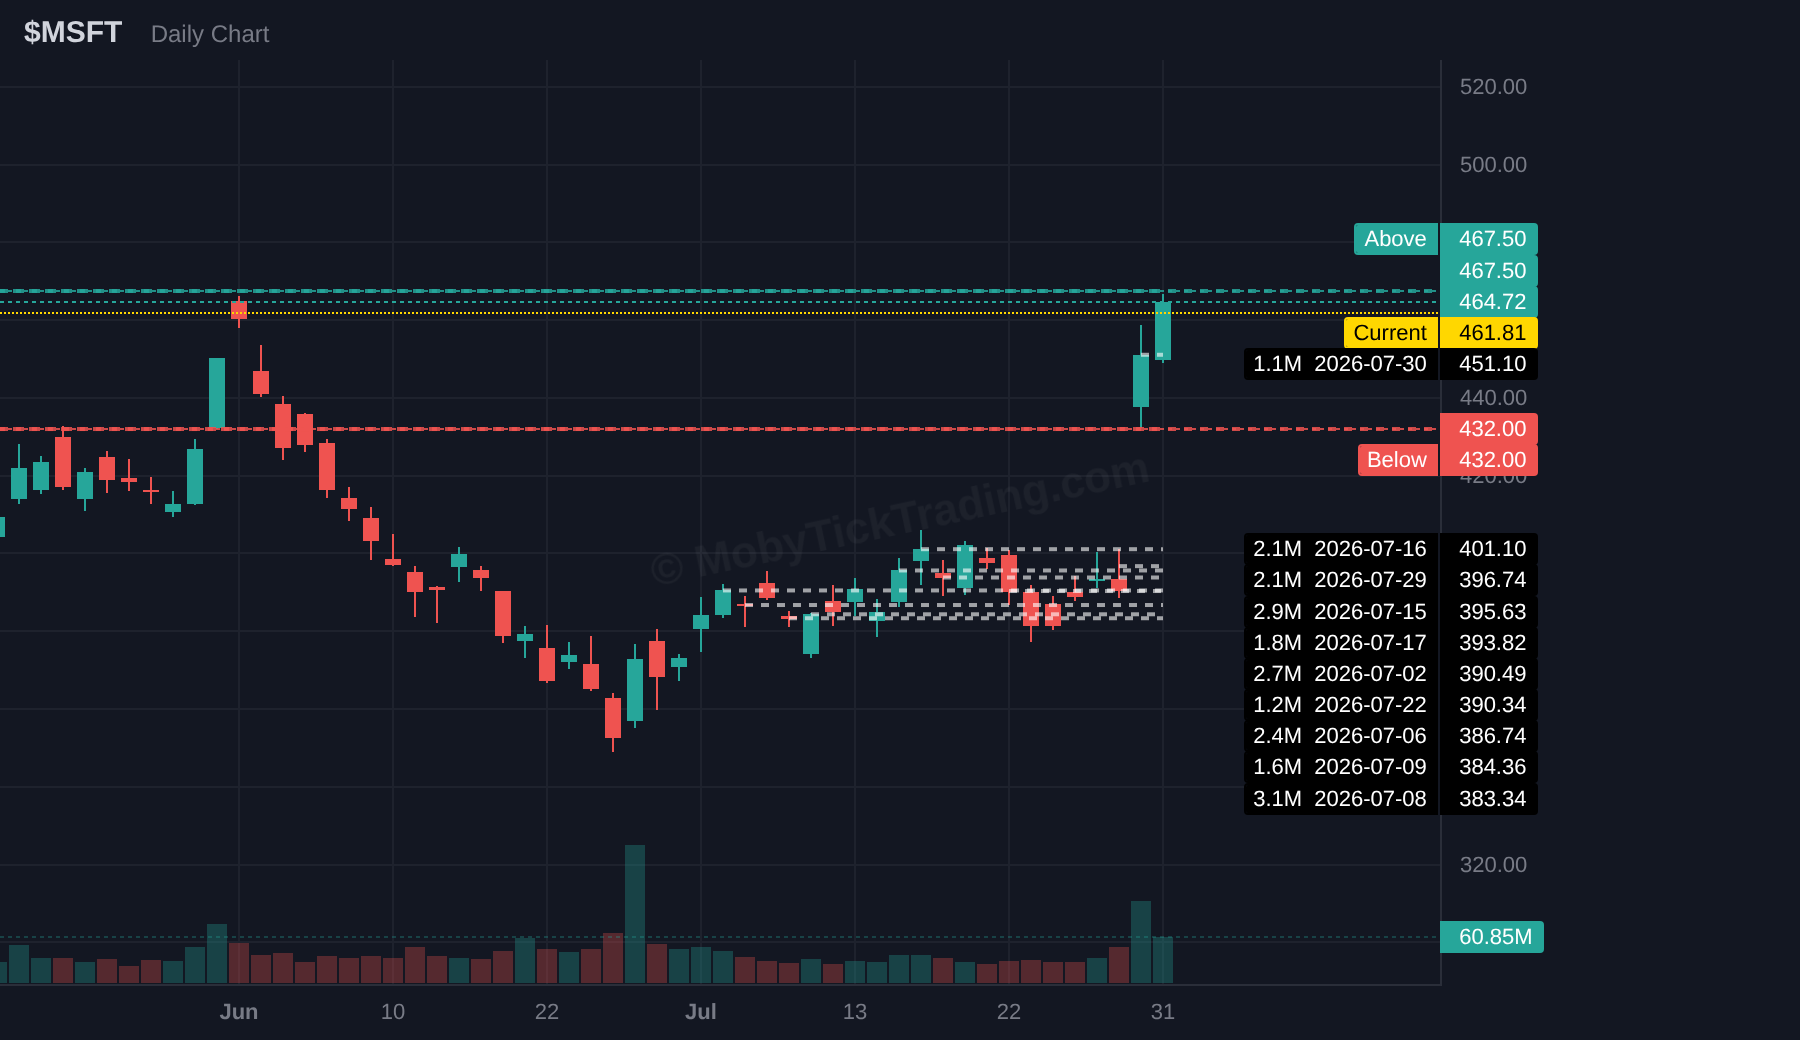
| MSFT | $467.5 | $470 → $475 → $480 → $500 → $512.5 → $520 |
| Ticker | Below Trigger | Targets |
|---|---|---|
| SPY | $735.00 | $730.00 → $727.50 → $725.00 → $720.00 → $715.00 → $712.50 |
| QQQ | $680.00 | $675.00 → $670.00 → $665.00 → $662.50 → $660.00 |
| IWM | $289.00 | $287.50 → $285.00 → $282.50 → $280.00 → $275.00 |
| RIVN | $15.00 | $14.00 → $13.00 → $12.50 → $11.00 → $10.00 |
| MRNA | $54.00 | $52.50 → $50.00 → $47.50 → $45.00 |
| LULU | $113.75 | $110.00 → $107.50 → $105.00 → $102.50 → $100.00 |
| MT | $66.00 | $62.50 → $60.00 → $57.50 → $55.00 |
| NVDA | $195.00 | $192.50 → $190.00 → $187.50 → $185.00 → $180.00 |
| AAPL | $300.00 | $297.50 → $295.00 → $292.50 → $290.00 → $285.00 → $280.00 |
| OWL | $9.25 | $9.00 → $8.50 → $8.00 → $7.50 → $7.00 → $6.00 |
| GOOGL | $330.00 | $325.00 → $320.00 → $315.00 → $312.50 → $310.00 → $305.00 → $300.00 |
| ITRI | $91.00 | $90.00 → $87.50 → $85.00 → $82.50 → $80.00 → $75.00 |
| MSFT | $432 | $425 → $412.5 → $400 → $297.5 → $295 |
Each card below shows the dark pool flow data for the past week, along with the key trigger levels and profit targets for the upcoming week. Dark pool stats are sourced from MobyTick’s proprietary analytics.
Above $755.00 → $757.50 → $760.00 → $765.00 → $770.00 → $775.00
Below $735.00 → $730.00 → $727.50 → $725.00 → $720.00 → $715.00 → $712.50
Above $696.00 → $700.00 → $705.00 → $710.00 → $715.00 → $720.00 → $722.50 → $730.00
Below $680.00 → $675.00 → $670.00 → $665.00 → $662.50 → $660.00
Above $297.00 → $300.00 → $302.50 → $305.00 → $310.00 → $312.50 → $315.00
Below $289.00 → $287.50 → $285.00 → $282.50 → $280.00 → $275.00
Above $17.50 → $18.00 → $18.50 → $19.00 → $20.00 → $21.00 → $22.50
Below $15.00 → $14.00 → $13.00 → $12.50 → $11.00 → $10.00
Above $60.00 → $62.50 → $65.00 → $67.50 → $70.00 → $72.50 → $75.00
Below $54.00 → $52.50 → $50.00 → $47.50 → $45.00
Above $121.00 → $122.50 → $125.00 → $127.50 → $130.00 → $132.50 → $135.00
Below $113.75 → $110.00 → $107.50 → $105.00 → $102.50 → $100.00
Above $71.25 → $72.50 → $75.00 → $77.50 → $80.00
Below $66.00 → $62.50 → $60.00 → $57.50 → $55.00
Above $205.00 → $207.50 → $210.00 → $212.50 → $215.00 → $217.50 → $220.00
Below $195.00 → $192.50 → $190.00 → $187.50 → $185.00 → $180.00
Above $315.00 → $317.50 → $320.00 → $322.50 → $325.00 → $327.50 → $330.00
Below $300.00 → $297.50 → $295.00 → $292.50 → $290.00 → $285.00 → $280.00
Above $10.50 → $11.00 → $11.50 → $12.00 → $12.50 → $13.00 → $13.75
Below $9.25 → $9.00 → $8.50 → $8.00 → $7.50 → $7.00 → $6.00
Above $360.00 → $365.00 → $370.00 → $375.00 → $380.00 → $387.50
Below $330.00 → $325.00 → $320.00 → $315.00 → $312.50 → $310.00 → $305.00 → $300.00
Above $102.50 → $105.00 → $107.00 → $110.00 → $112.50 → $115.00
Below $91.00 → $90.00 → $87.50 → $85.00 → $82.50 → $80.00 → $75.00
Above $467.5 → $470 → $475 → $480 → $500 → $512.5 → $520
Below $432 → $425 → $412.5 → $400 → $297.5 → $295
Broad market: $25.5B, and SPY took 61% of it.
Dark pool flow across the five major index vehicles totaled $25.48B for Jul 27–31. SPY carried $15.55B on 23 prints (21.0M shares, $739.03 average) — 61.0% of all broad-market ETF flow by itself. QQQ followed at $6.64B across 16 prints (9.8M shares, $679.04 average), or 26.0%. Together the two took 87% of the broad tape.
IWM registered $643.3M on just 4 prints — 2.5% of broad flow, the thinnest block participation of the group. IVV ($1.40B, 2 prints) and VOO ($1.26B, 4 prints) each cleared it on notional.
For session context: SPY’s weekly block shares equal 33.7% of its 7/31 session volume of 62,445,899; QQQ’s equal 19.3% of its 50,540,484.
Sector SPDRs: $2.81B, one name took nearly half.
Sector flow totaled $2.81B — about 11% of broad-market volume, a 9-to-1 split. XLF led at $1.31B on 21 prints (23.0M shares, $57.07 average), taking 46.6% of all sector flow, the highest sector print count and largest share count of the group. XLF also closed +1.12%, the strongest listed sector ETF. Heaviest sector block flow and best sector close landed in the same name.
Behind XLF: XLV $479.1M (6 prints), XLP $257.2M (5), XLK $190.8M (2), XLE $186.0M (3), XLI $162.1M (1 print), XLC $148.9M (2). At the bottom, XLB and XLY both registered zero qualifying prints, with XLU ($33.3M) and XLRE ($44.8M) each clearing under $45M. XLB was also the weakest sector close ex-semis at −1.62% — no block participation, no price support.
The concentration read.
Index gains were narrow. SPY +1.10% against IWM +0.01% — small caps flat while the S&P vehicle advanced. The move traced to a handful of names: MSFT +21.75% and GOOGL +11.38%, against AAPL −7.24% and NVDA −2.94% in the same mega-cap complex.
Block flow was distributed the other way. On the full weekly tape, AAPL ($10.36B, 42 prints) and NVDA ($8.90B, 74 prints) drew $19.27B combined — 2.06x the $9.36B across MSFT ($6.96B, 53 prints) and GOOGL ($2.41B, 20 prints). The two names that closed lower absorbed twice the block notional of the two that drove the index.
Semis were the outlier on print size. SMH pulled $15.85B on only 9 prints — an average of $1.76B and 3.24M shares per print, the largest average block in the dataset — while closing −3.68%, the weakest ETF on the list. Concentrated size, few prints, lowest close.
Dark pool prints do not disclose which side initiated, so none of the above assigns positioning.
*Data sourced from MobyTick. 740 prints captured Jul 27–31, 2026. Broad and sector ETF totals on qualifying-print basis; single-name totals on full weekly tape.*
Every dark pool print has a price attached to it. Aggregate a week’s worth of prints in one name and you get an average print price — the level where institutional size actually changed hands. That number isn’t a prediction. It’s a receipt.
A recovery cross is what happens when price dips below that receipt and then closes back above it. The setup matters because the average print price marks a zone institutions were willing to pay. When price trades under it, those positions are underwater. When price closes back over it, the zone held — the accumulation absorbed the dip instead of being unwound into it.
The pattern has three steps:
MSFT is the week’s textbook case. Dark pool prints averaged $418.69 across 53 prints in all five sessions — roughly $6.95B. Price spent Monday through Wednesday entirely *underneath* that level, with a weekly low of $387.99 on Monday, 7.3% below the zone. Then Thursday gapped to $437.90 and Friday closed at $464.72 — 11.0% above the dark pool average, and the largest single-name weekly gain on our tape at +21.75%. The dip didn’t break the zone. It got reclaimed and left behind.
Three more from the same week. GOOGL: 20 prints averaging $336.08, low of $324.44, close $356.13 — 6.0% above, the cleanest percentage recovery after MSFT. MT: only 600,000 shares, but a Monday cluster at $67.04 accounting for 480,000 of them, averaging $66.98; price dipped to $65.04 Wednesday and closed $70.14, 4.7% above. NVDA: the week’s busiest name at 74 prints, average $196.12, low $190.01, close $200.75 — 2.4% above. Both index ETFs did it too, SPY closing 1.1% over its $738.54 average and QQQ 1.8% over $675.87 on 117 prints.
Now the flip side. AAPL carried the biggest single-name flow of the week — $10.4B across 42 prints in all five sessions, averaging $329.40. It closed at $308.91, or 6.2% below the accumulation zone. Same volume of institutional footprint, opposite outcome. The cross failed, and Friday’s session did the damage.
That’s the whole lesson: size tells you where institutions transacted, not which direction they’ll be right. The close relative to the print average is what separates a zone that held from a zone that gave way. Big prints aren’t bullish by themselves — reclaimed prints are the ones worth flagging.
*Data sourced from MobyTick.*
Get institutional-grade dark pool intelligence delivered to your inbox every week.
Disclaimer: This newsletter is for informational and educational purposes only. It does not constitute financial advice, investment recommendations, or solicitation to buy or sell securities. Trading stocks, ETFs, and options involves substantial risk of loss. Past performance is not indicative of future results.