
Market Overview
Index ETFs finished the week mixed, with small caps and the Nasdaq 100 leading and the Dow lagging. A benign July CPI print on Wednesday anchored the macro calendar, the S&P 500 set fresh record closes midweek, and AI-infrastructure headlines carried the single-name tape from Monday through Friday. Energy separated from every other sector by a wide margin, and institutional dark pool activity stayed concentrated in mega-cap technology, semiconductors, and broad index ETFs. Measured from the Monday, August 10 open to the Friday, August 14 close:
| ETF | Index | Open → Close | Change |
|---|---|---|---|
| SPY | S&P 500 | 772.60 → 776.34 | +0.48% |
| QQQ | Nasdaq 100 | 722.39 → 731.07 | +1.20% |
| IWM | Russell 2000 | 300.51 → 305.09 | +1.52% |
| DIA | Dow 30 | 538.70 → 536.80 | −0.35% |
Sector performance was broad but uneven. Energy (XLE) was the week’s standout at +6.39%, followed by Utilities (XLU) +2.03%, Consumer Staples (XLP) +1.69%, Communication Services (XLC) +1.54%, Real Estate (XLRE) +1.26%, Financials (XLF) +1.08%, Technology (XLK) +1.03%, and Health Care (XLV) +1.02%. Industrials (XLI) added +0.31%. Two sectors finished lower: Materials (XLB) −0.51% and Consumer Discretionary (XLY) −0.86%. Nine of eleven SPDR sectors closed green, but the spread between the best and worst sector was roughly 725 basis points — nearly all of it attributable to energy. Defensive groups clustered near the top of the table alongside energy, while the two decliners were both cyclically sensitive. Semiconductor ETFs trailed the broader tech tape despite the AI headlines, with SMH +0.31% and SOXX +0.84% for the week, both finishing behind XLK and well behind QQQ.
Macro data. July CPI, released Wednesday, August 12, came in at +0.1% m/m and +3.4% y/y on the headline, in line with consensus, while core printed +0.2% m/m and +2.5% y/y. The benign report eased the market’s debate over a possible September rate move, and it landed on the same session that produced the week’s record S&P 500 close. July PPI followed on Thursday, August 13, extending the inflation read from the consumer side to the producer side. Friday, August 14 brought July Retail Sales alongside the University of Michigan consumer sentiment reading, rounding out a calendar that moved from prices to producers to the consumer across three consecutive sessions. The sequencing gave the week a distinct shape: a data-heavy midweek stretch bracketed by an AI-driven Monday and a Friday dominated by earnings reactions and index-inclusion news.
Index records. The S&P 500 closed at a record 7,798.99 on Wednesday and set further records on Thursday. Two of the three major indices were on pace for a third consecutive weekly gain heading into Friday. The Dow was the outlier, finishing the measurement window lower at −0.35% while the Russell 2000 led all four index ETFs at +1.52%.
AI infrastructure and earnings. The week’s single-name action was dominated by AI capex. CoreWeave (CRWV) reported Q2 revenue up 112.5% y/y to $2.58B, a beat. Nebius (NBIS) gained 34% after Q2 revenue rose 454% y/y to $582.3M alongside a raised contracted-power target. Super Micro (SMCI) advanced on a blowout sales outlook, and Cava rose roughly 12% on earnings. Nvidia (NVDA) announced an approximately $500B AI-infrastructure financing partnership with six Wall Street firms — including Apollo, BlackRock, Goldman Sachs, and KKR — to fund data-center buildouts. Intel (INTC) upsized an offering to $20B at $95 per share from $15B, closing August 12, with proceeds earmarked for physical AI, silicon, advanced packaging, and 2026 capex. Applied Materials (AMAT) reported FQ3 revenue of $9.12B (+25% y/y) and EPS of $3.50, both beats, but traded lower — roughly −5% in Friday premarket — as guidance underwhelmed. Oracle (ORCL) fell about 4% early in the week on AI-capex concerns, a move that preceded the later run of AI-positive headlines. Reddit (RDDT) rose approximately 12% in Friday premarket after S&P Dow Jones announced it would join the S&P 500. The through-line was capital formation: an offering upsize, a half-trillion-dollar financing consortium, a raised power target, and triple-digit revenue growth at two compute providers all landed inside five sessions.
Energy and commodities. Oil traded elevated early in the week on Iran and Strait of Hormuz tensions before easing. Energy finished as the week’s best-performing sector at +6.39%, more than three times the return of the next-best group, and the only sector to post a mid-single-digit weekly move. The early-week bid and subsequent easing left XLE holding the bulk of its gain into Friday’s close.
Dark pool flow. Institutional flow was concentrated in mega-cap technology and semiconductors. Broad index ETFs dominated total dollar volume, led by SPY at roughly $9.98B, IVV at roughly $3.34B, and QQQ at roughly $2.83B. Among single names, the largest genuine intraday blocks of the week were in SNDK at $667M and MSFT at $370M and $306M, followed by BKR at $245M across multiple trades and additional size in AMD. INTC saw steady accumulation across August 12–13, coinciding with the close of its upsized offering — a pattern that lined up with the week’s largest capital-raise event.
Scorecard recap. Of last week’s 12 callouts, 11 triggered above and none triggered below, leaving INFY as the lone no-trigger. Eight of the triggered names reached at least one target. The standouts were VEEV, which ran +9.6% past its $231.25 trigger and tagged T4 at $250; PATH at +10.7%; SPCX at +6.9% through T2; and PLTR at +4.5% through T1. Two came down to the wire: NVDA cleared its $225 trigger but missed T1 at $227.50 by a single cent, printing a $227.49 high, and SPY cleared $777 before stalling shy of T1 at $780.
*Data sourced from MobyTick*
Last Week’s Callout Performance
| Ticker | Above | Below | High | Low | Close | Triggered | Targets Hit | Move From Trigger |
|---|---|---|---|---|---|---|---|---|
| SPY | 777 | 768 | 779.37 | 769.200 | 776.34 | Above | 0 of 4 | $777 → $779.37 (+0.31%) |
| QQQ | 728.5 | 710 | 734.39 | 715.500 | 731.07 | Above | 1 of 5 → T1 ($731.25) | $728.5 → $734.39 (+0.81%) |
| IWM | 303.25 | 297 | 305.18 | 299.080 | 305.09 | Above | 1 of 5 → T1 ($305) | $303.25 → $305.18 (+0.64%) |
| INFY | 12.75 | 12 | 12.72 | 12.055 | 12.09 | None | Not triggered | — |
| SPCX | 140 | 107 | 149.60 | 130.170 | 140.00 | Above | 2 of 7 → T2 ($145) | $140 → $149.6 (+6.86%) |
| CMCSA | 25.62 | 24 | 26.49 | 24.775 | 26.18 | Above | 1 of 5 → T1 ($26) | $25.62 → $26.49 (+3.40%) |
| PATH | 15.2 | 13.5 | 16.82 | 14.730 | 16.01 | Above | 1 of 4 → T1 ($16) | $15.2 → $16.82 (+10.66%) |
| NVDA | 225 | 215 | 227.49 | 216.200 | 225.16 | Above | 0 of 4 | $225 → $227.49 (+1.11%) |
| PLTR | 172.5 | 157.5 | 180.18 | 168.340 | 174.04 | Above | 1 of 5 → T1 ($180) | $172.5 → $180.18 (+4.45%) |
| KGC | 28 | 26.5 | 28.04 | 26.540 | 27.31 | Above | 0 of 7 | $28 → $28.04 (+0.14%) |
| XME | 116.25 | 109.75 | 119.72 | 115.170 | 117.14 | Above | 1 of 6 → T1 ($117.5) | $116.25 → $119.725 (+2.99%) |
| VEEV | 231.25 | 208.25 | 253.48 | 228.370 | 243.75 | Above | 4 of 6 → T4 ($250) | $231.25 → $253.48 (+9.61%) |
Bullish Setups — Above Trigger
| Ticker | Above Trigger | Targets |
|---|---|---|
| SPY | $780.00 | $785.00 → $790.00 → $795.00 → $800.00 |
| QQQ | $732.50 | $740.00 → $745.00 → $750.00 → $755.00 → $760.00 → $770.00 |
| IWM | $306.00 | $307.50 → $310.00 → $312.50 → $315.00 → $317.50 → $320.00 |
| HAL | $35.00 | $36.00 → $37.00 → $38.00 → $39.00 → $40.00 |
| PM | $191.00 | $192.00 → $193.00 → $195.00 → $197.50 → $200.00 |
| CELH | $30.50 | $31.25 → $32.50 → $35.00 → $36.25 → $37.50 |
| NVDA | $227.50 | $230.00 → $235.00 → $237.50 → $240.00 → $242.50 → $245.00 |
| NBIS | $280.00 | $290.00 → $300.00 → $310.00 → $320.00 → $330.00 |
| AMZN | $272.50 | $276.25 → $277.50 → $280.00 → $284.00 → $287.50 → $290.00 |
| MSFT | $505.00 | $510.00 → $515.00 → $520.00 → $525.00 → $530.00 → $540.00 |
| FLUT | $102.50 | $105.00 → $107.50 → $110.00 → $112.50 → $115.00 → $120.00 |
| AMAT | $530 | $545 → $560 → $577 → $590 → $602.5 → $615 → $625 |
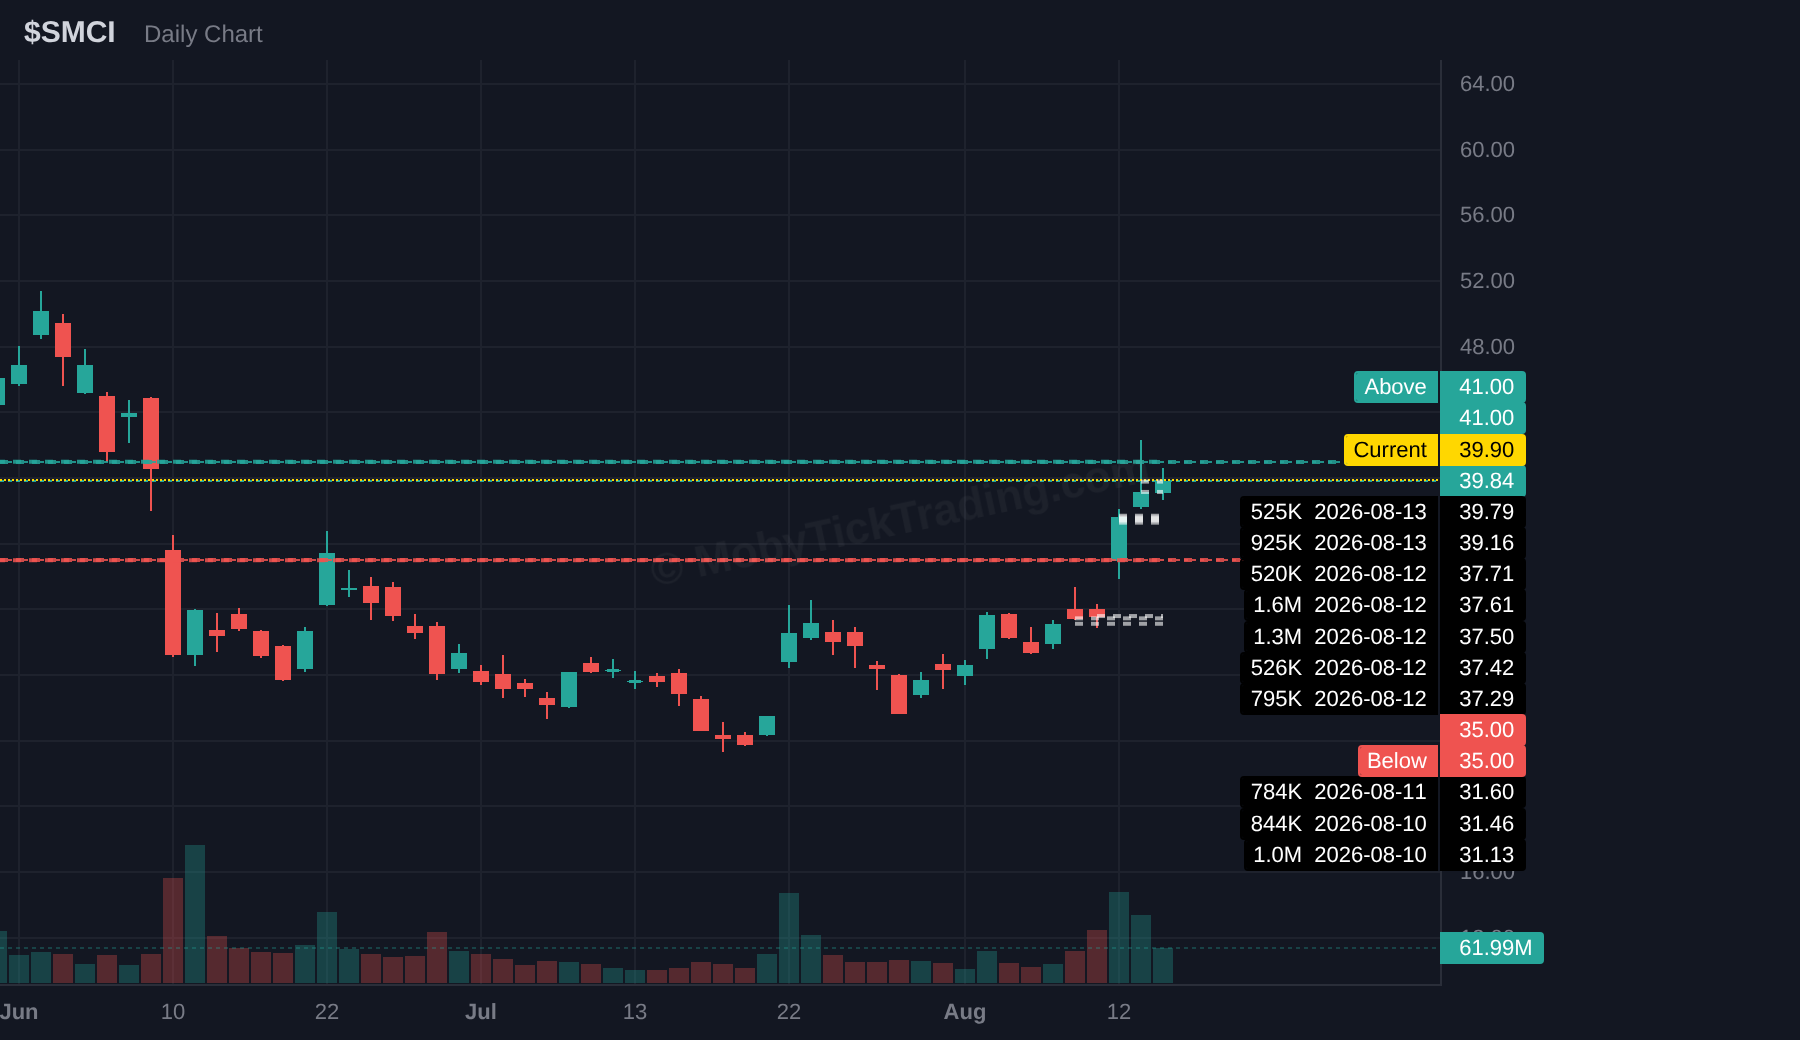
| SMCI | $41 | $42.5 → $45 → $46.50 → $48.25 → $50 |
Bearish Setups — Below Trigger
| Ticker | Below Trigger | Targets |
|---|---|---|
| SPY | $770.00 | $765.00 → $762.50 → $760.00 → $757.50 → $750.00 |
| QQQ | $720.00 | $715.00 → $710.00 → $705.00 → $700.00 |
| IWM | $300.00 | $297.50 → $295.00 → $292.50 → $290.00 → $287.50 → $285.00 |
| HAL | $31.80 | $31.00 → $30.00 → $29.00 → $28.00 → $27.00 → $26.00 → $25.00 |
| PM | $186.00 | $185.00 → $183.00 → $183.00 → $180.00 → $178.00 |
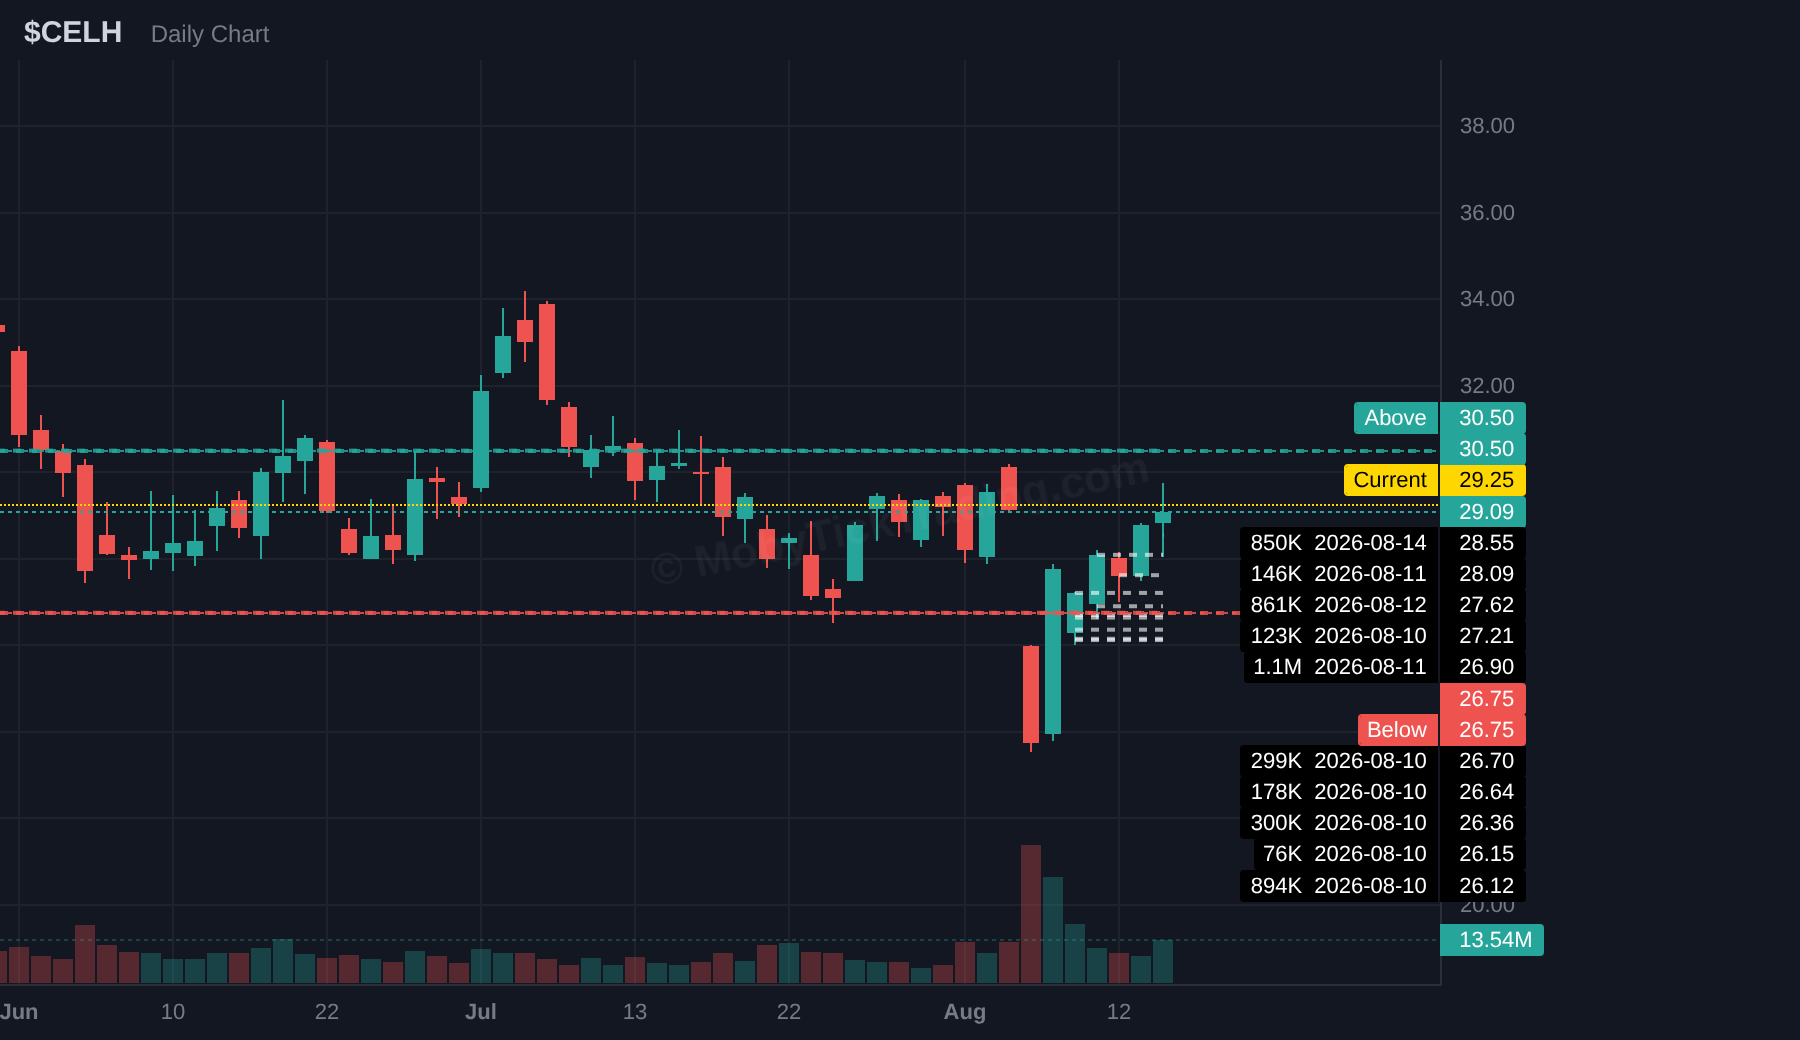
| CELH | $26.75 | $26.12 → $25.00 → $24.00 → $22.50 → $20.00 |
| NVDA | $217.50 | $215.00 → $210.00 → $205.00 → $200.00 |
| NBIS | $224.00 | $212.50 → $200.00 → $195.00 → $187.50 → $175.00 |
| AMZN | $262.50 | $260.00 → $255.00 → $250.00 → $247.50 → $246.00 |
| MSFT | $490.00 | $480.00 → $470.00 → $461.25 → $450.00 → $440.00 |
| FLUT | $100.00 | $97.50 → $95.00 → $93.00 → $91.00 → $90.00 |
| AMAT | $500 | $480 → $460 → $455 → $440 → $425 → $415 |
| SMCI | $35 | $34 → $33 → $32 → $30 → $27.50 → $25 |
This Week’s Setups — Ticker Detail
Each card below shows the dark pool flow data for the past week, along with the key trigger levels and profit targets for the upcoming week. Dark pool stats are sourced from MobyTick’s proprietary analytics.
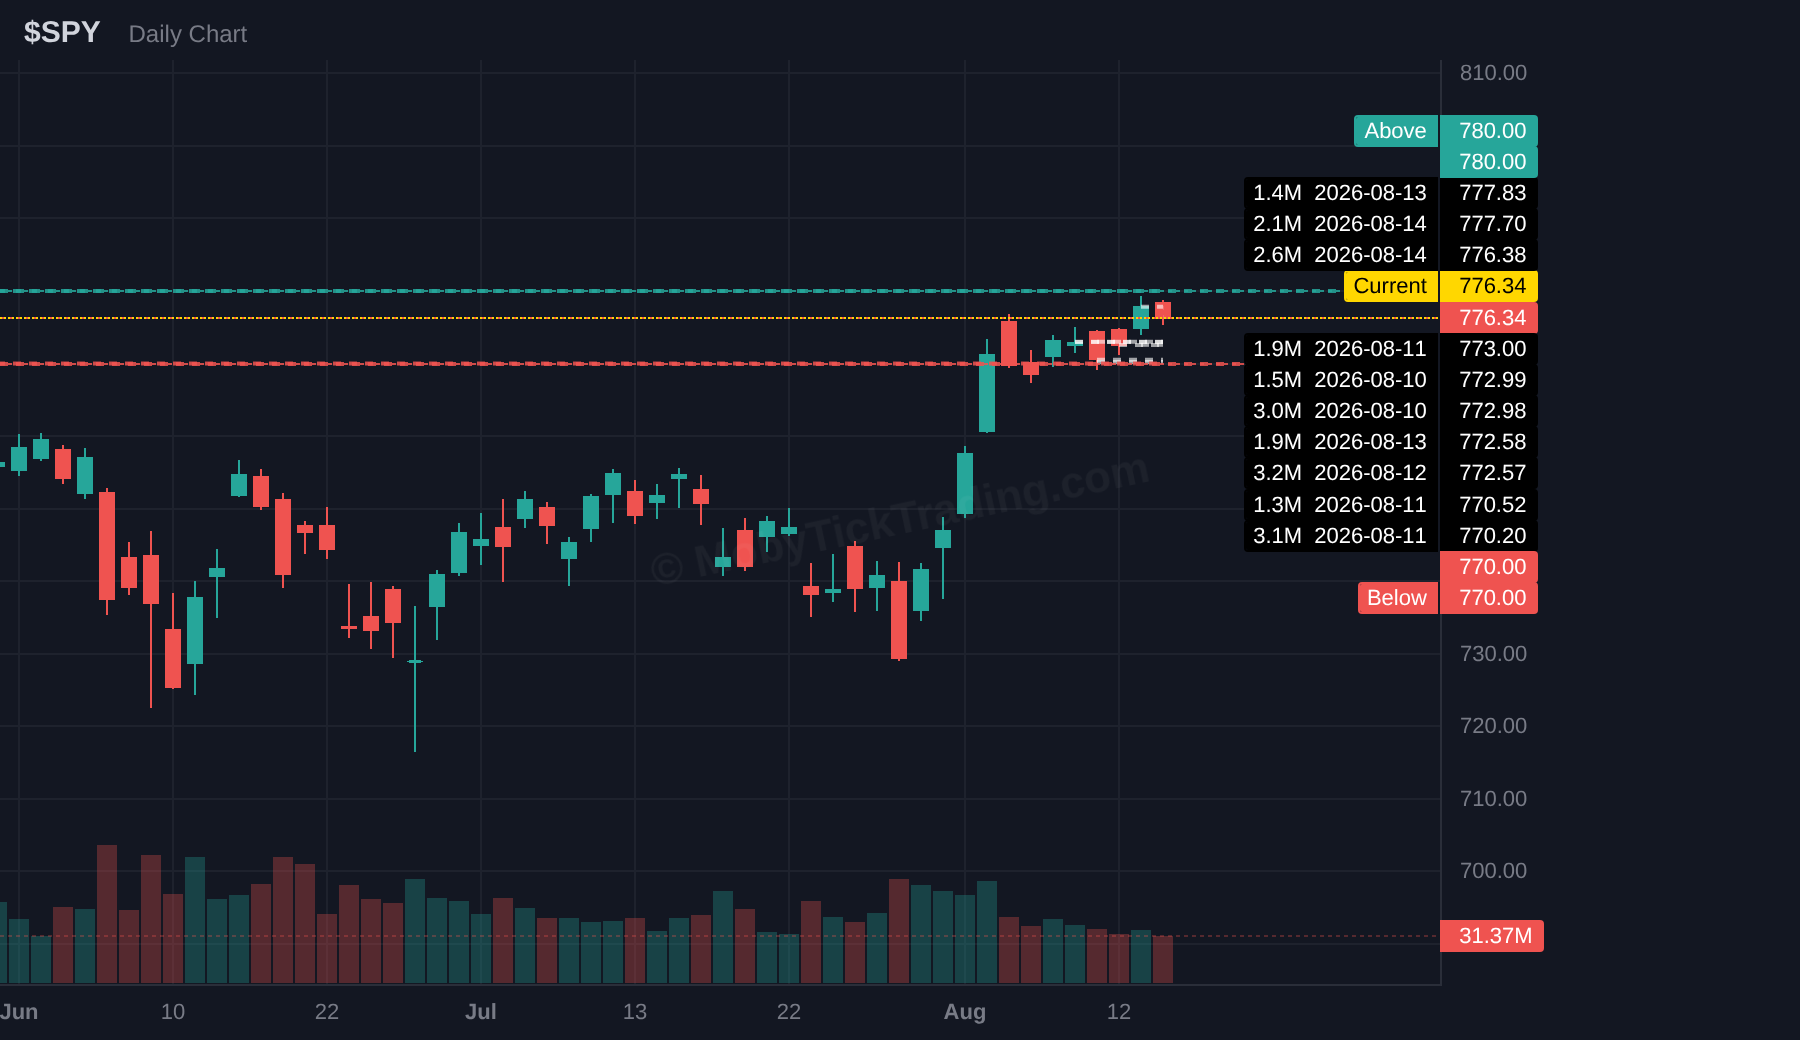
SPY
Above $780.00 → $785.00 → $790.00 → $795.00 → $800.00
Below $770.00 → $765.00 → $762.50 → $760.00 → $757.50 → $750.00
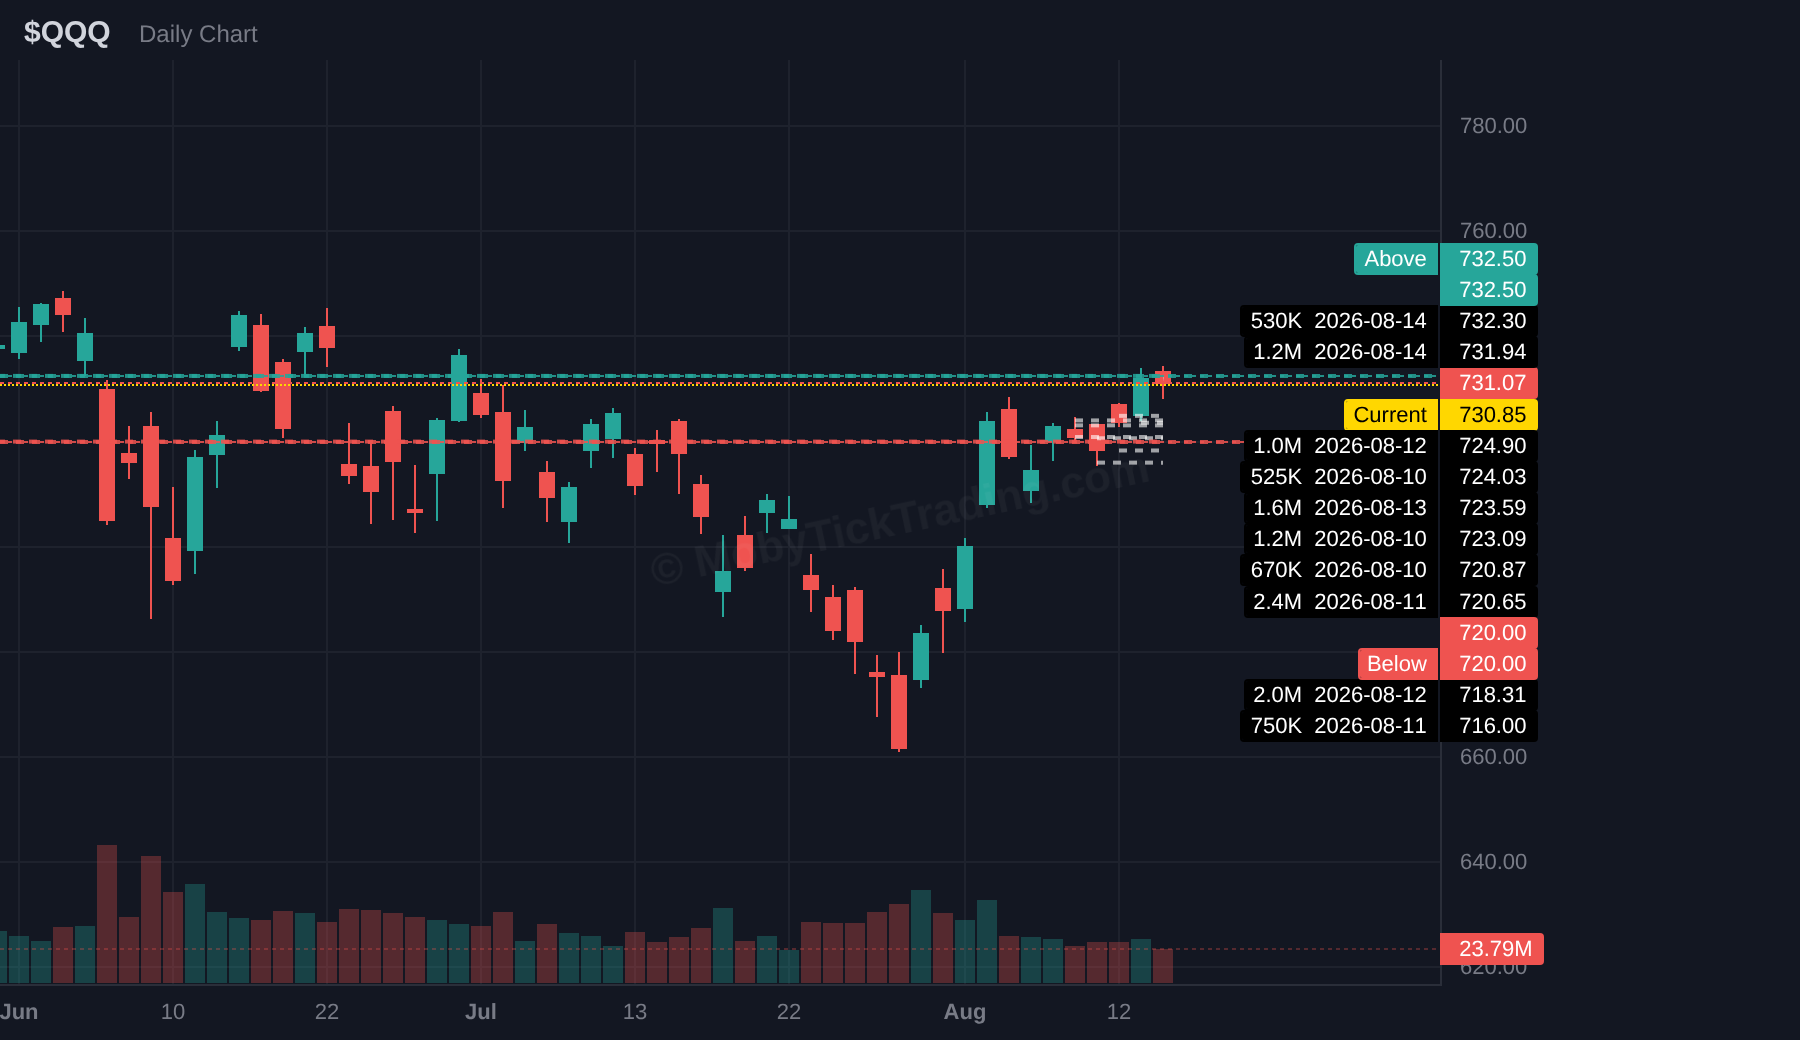
QQQ
Above $732.50 → $740.00 → $745.00 → $750.00 → $755.00 → $760.00 → $770.00
Below $720.00 → $715.00 → $710.00 → $705.00 → $700.00
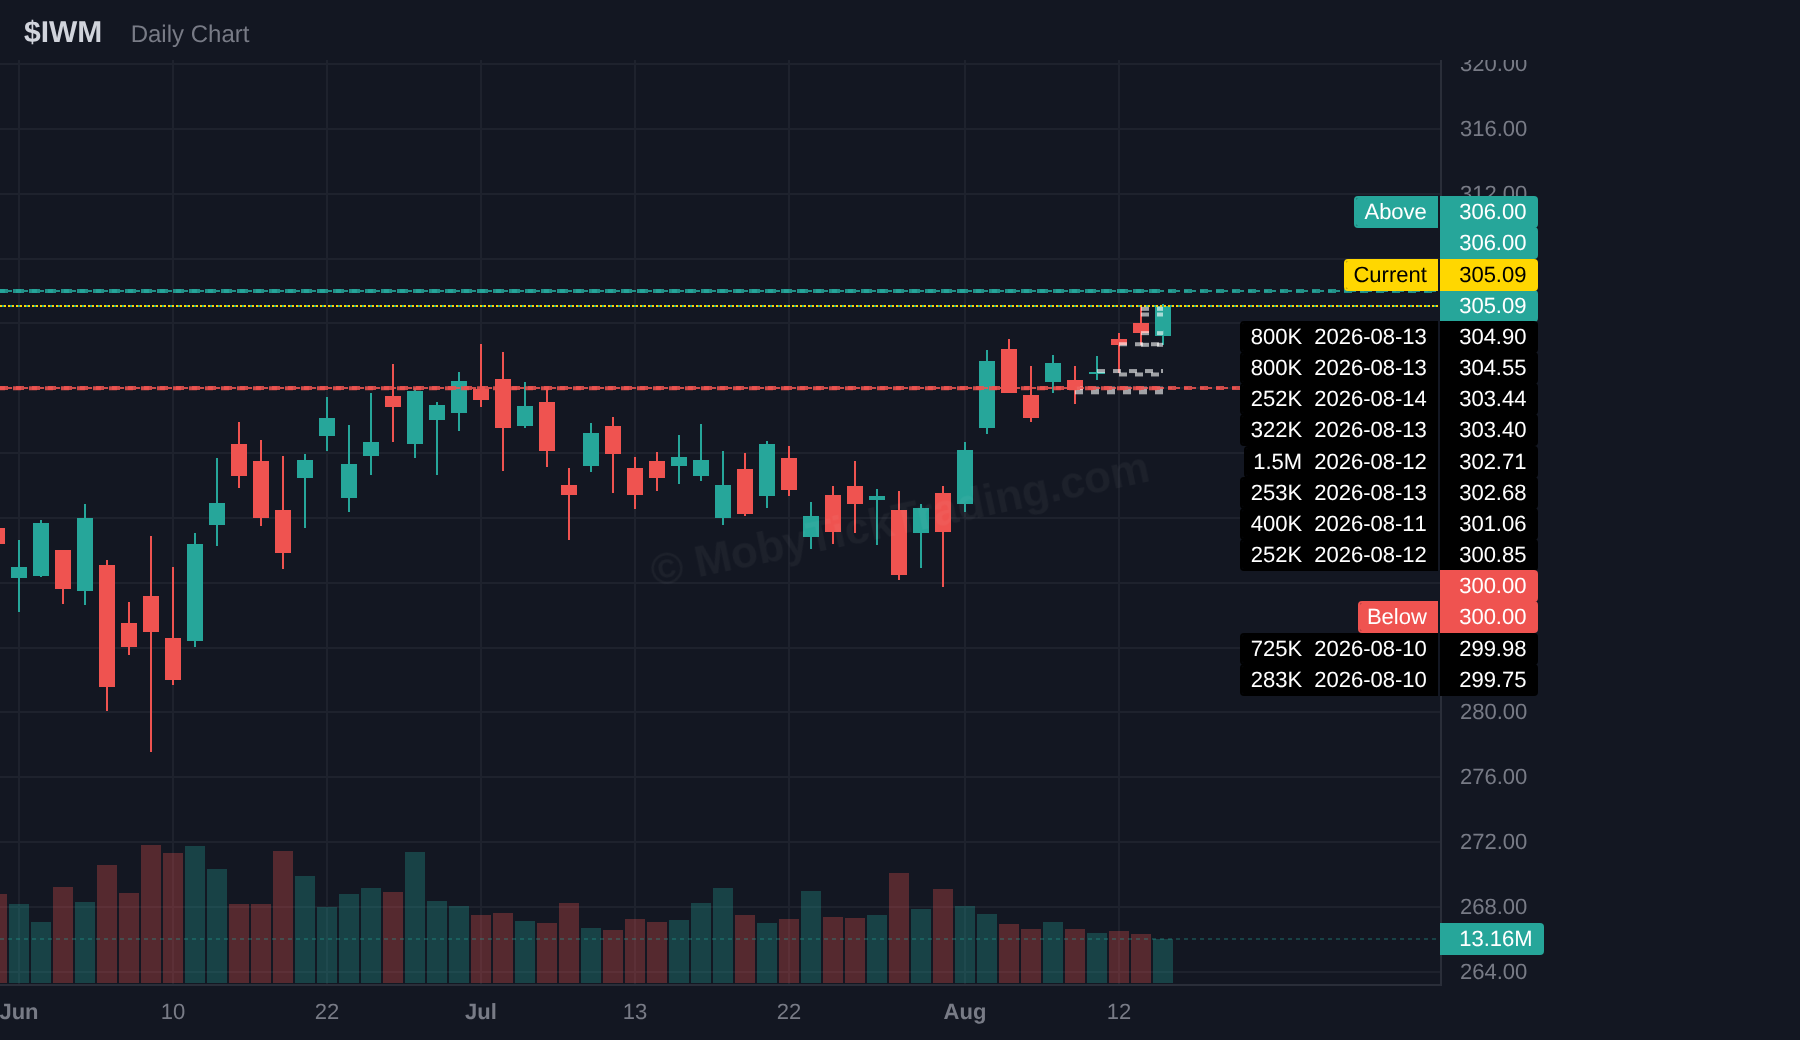
IWM
Above $306.00 → $307.50 → $310.00 → $312.50 → $315.00 → $317.50 → $320.00
Below $300.00 → $297.50 → $295.00 → $292.50 → $290.00 → $287.50 → $285.00
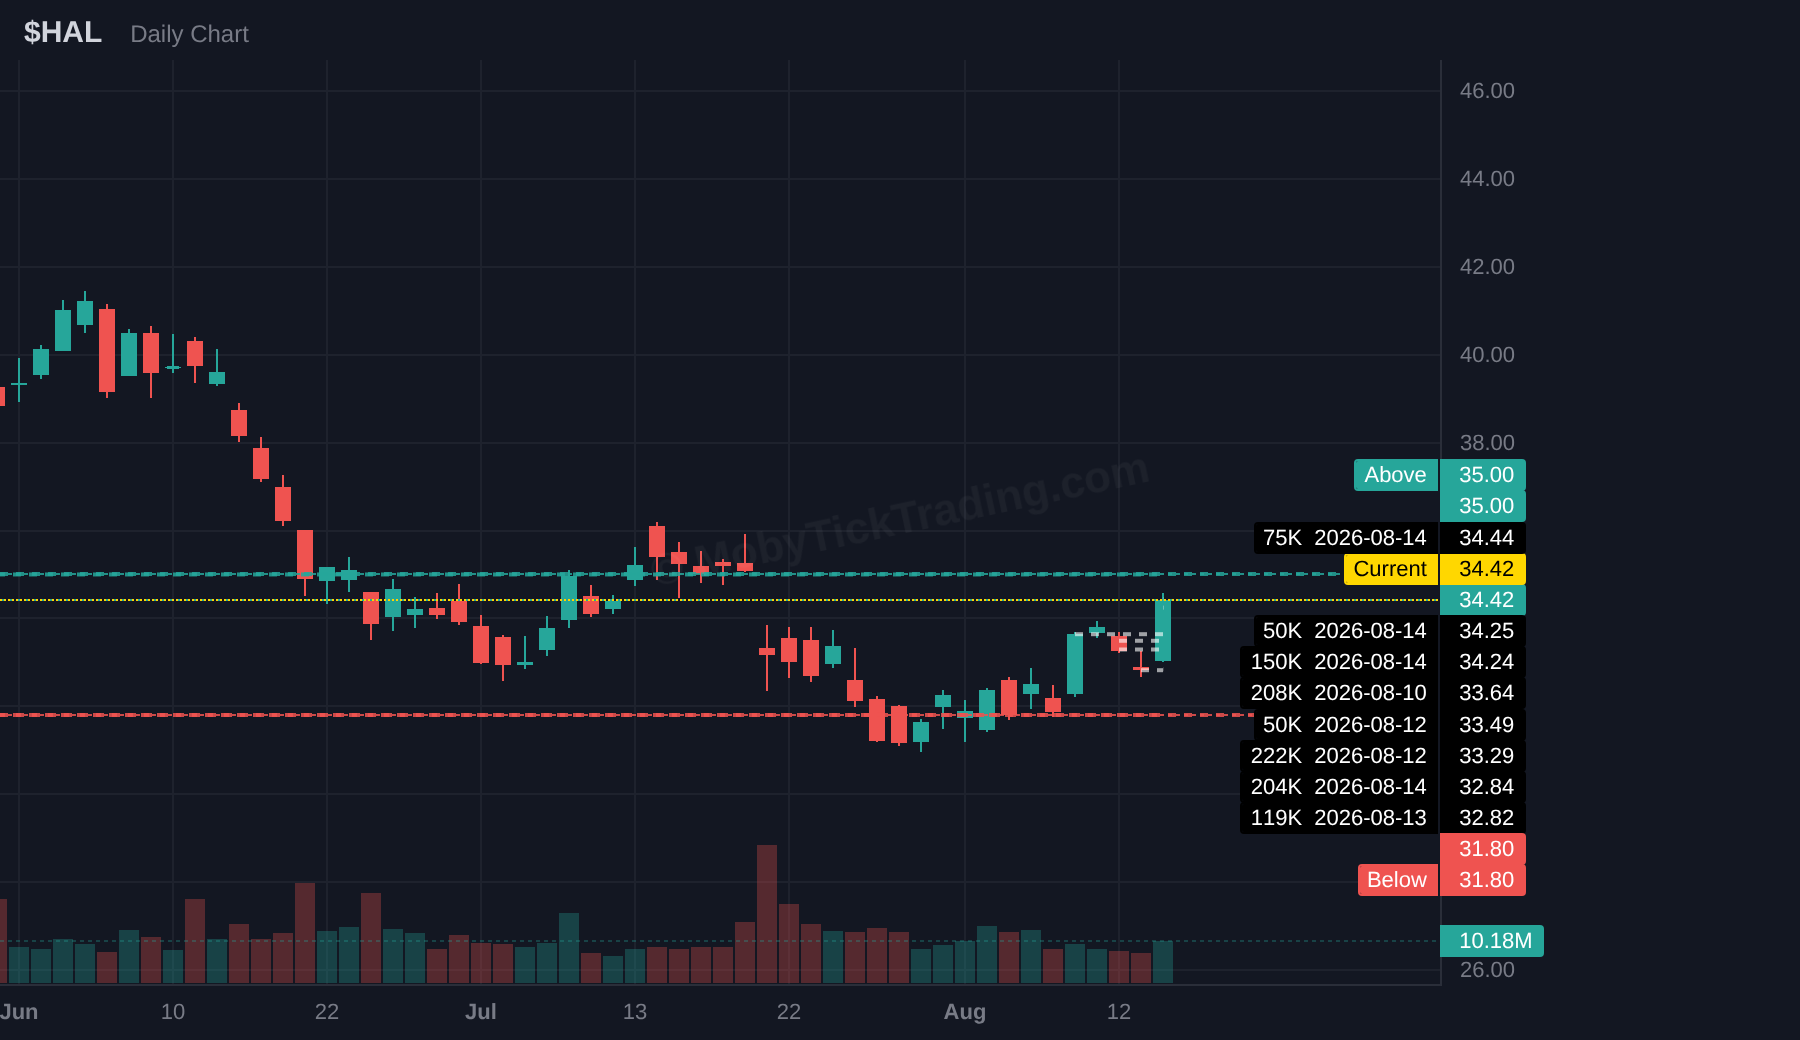
HAL
Above $35.00 → $36.00 → $37.00 → $38.00 → $39.00 → $40.00
Below $31.80 → $31.00 → $30.00 → $29.00 → $28.00 → $27.00 → $26.00 → $25.00
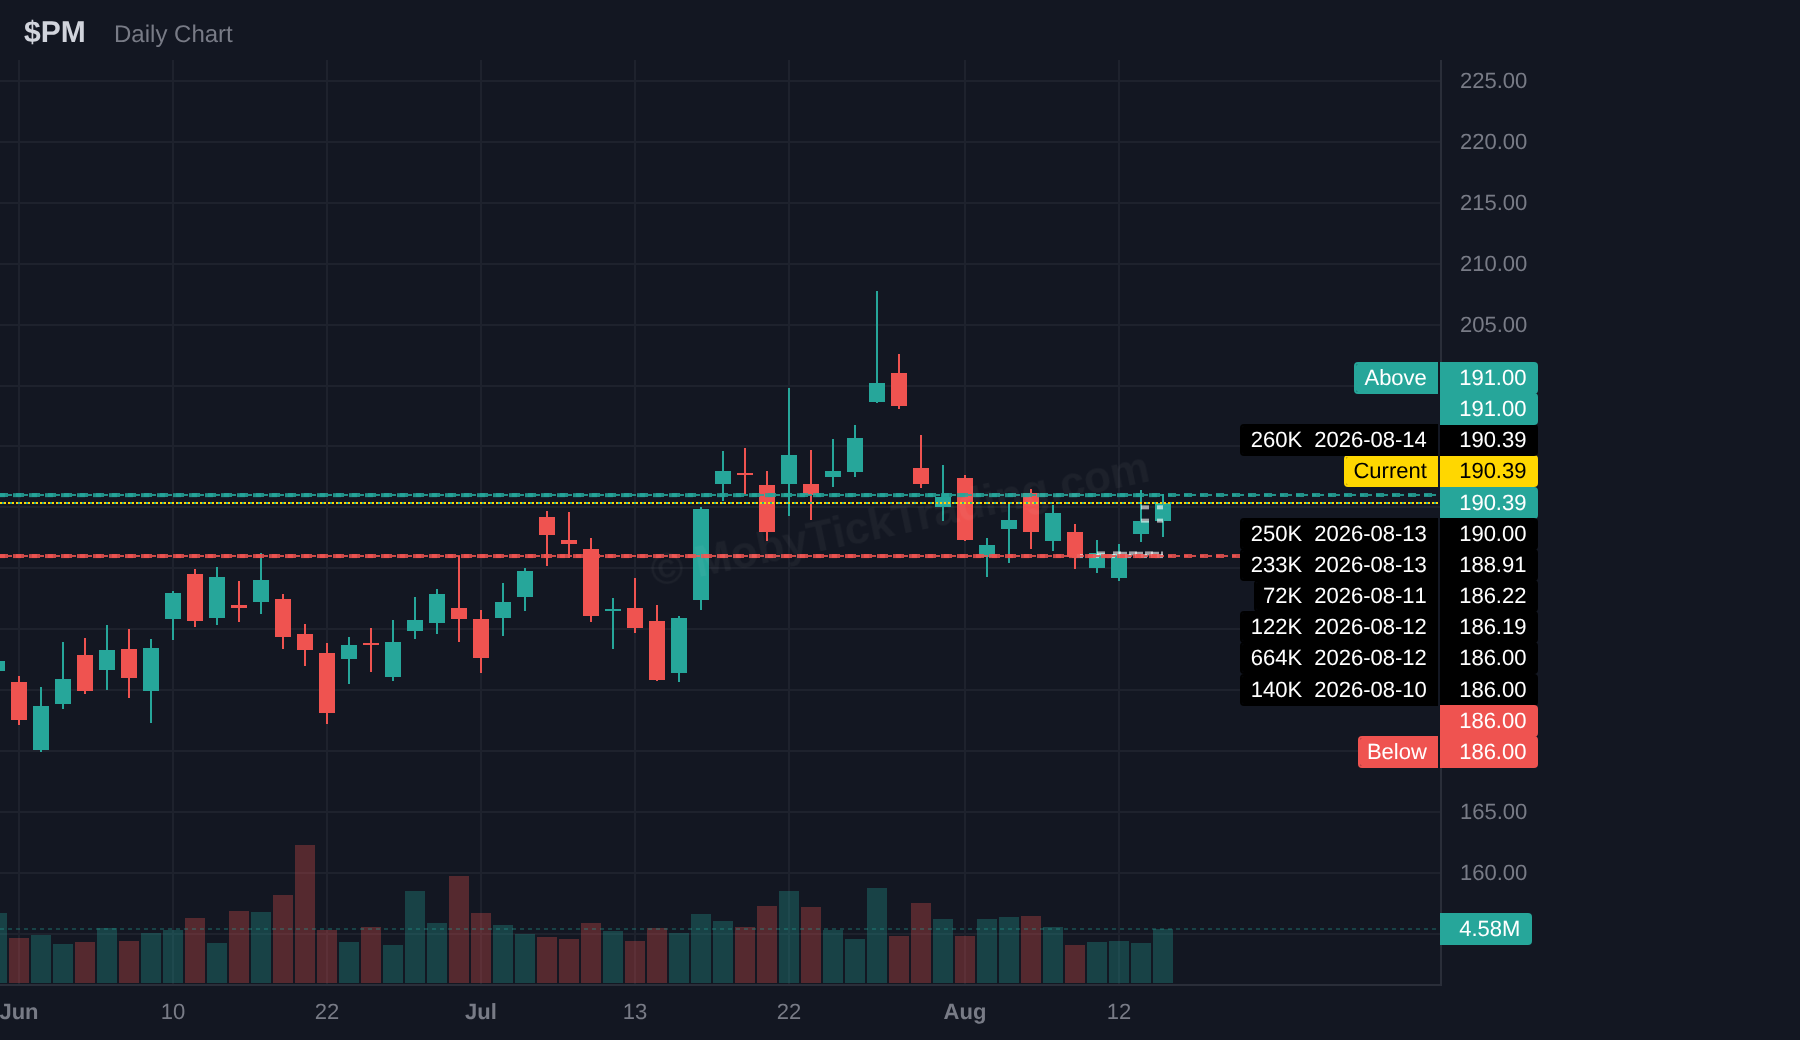
PM
Above $191.00 → $192.00 → $193.00 → $195.00 → $197.50 → $200.00
Below $186.00 → $185.00 → $183.00 → $183.00 → $180.00 → $178.00
CELH
Above $30.50 → $31.25 → $32.50 → $35.00 → $36.25 → $37.50
Below $26.75 → $26.12 → $25.00 → $24.00 → $22.50 → $20.00
NVDA
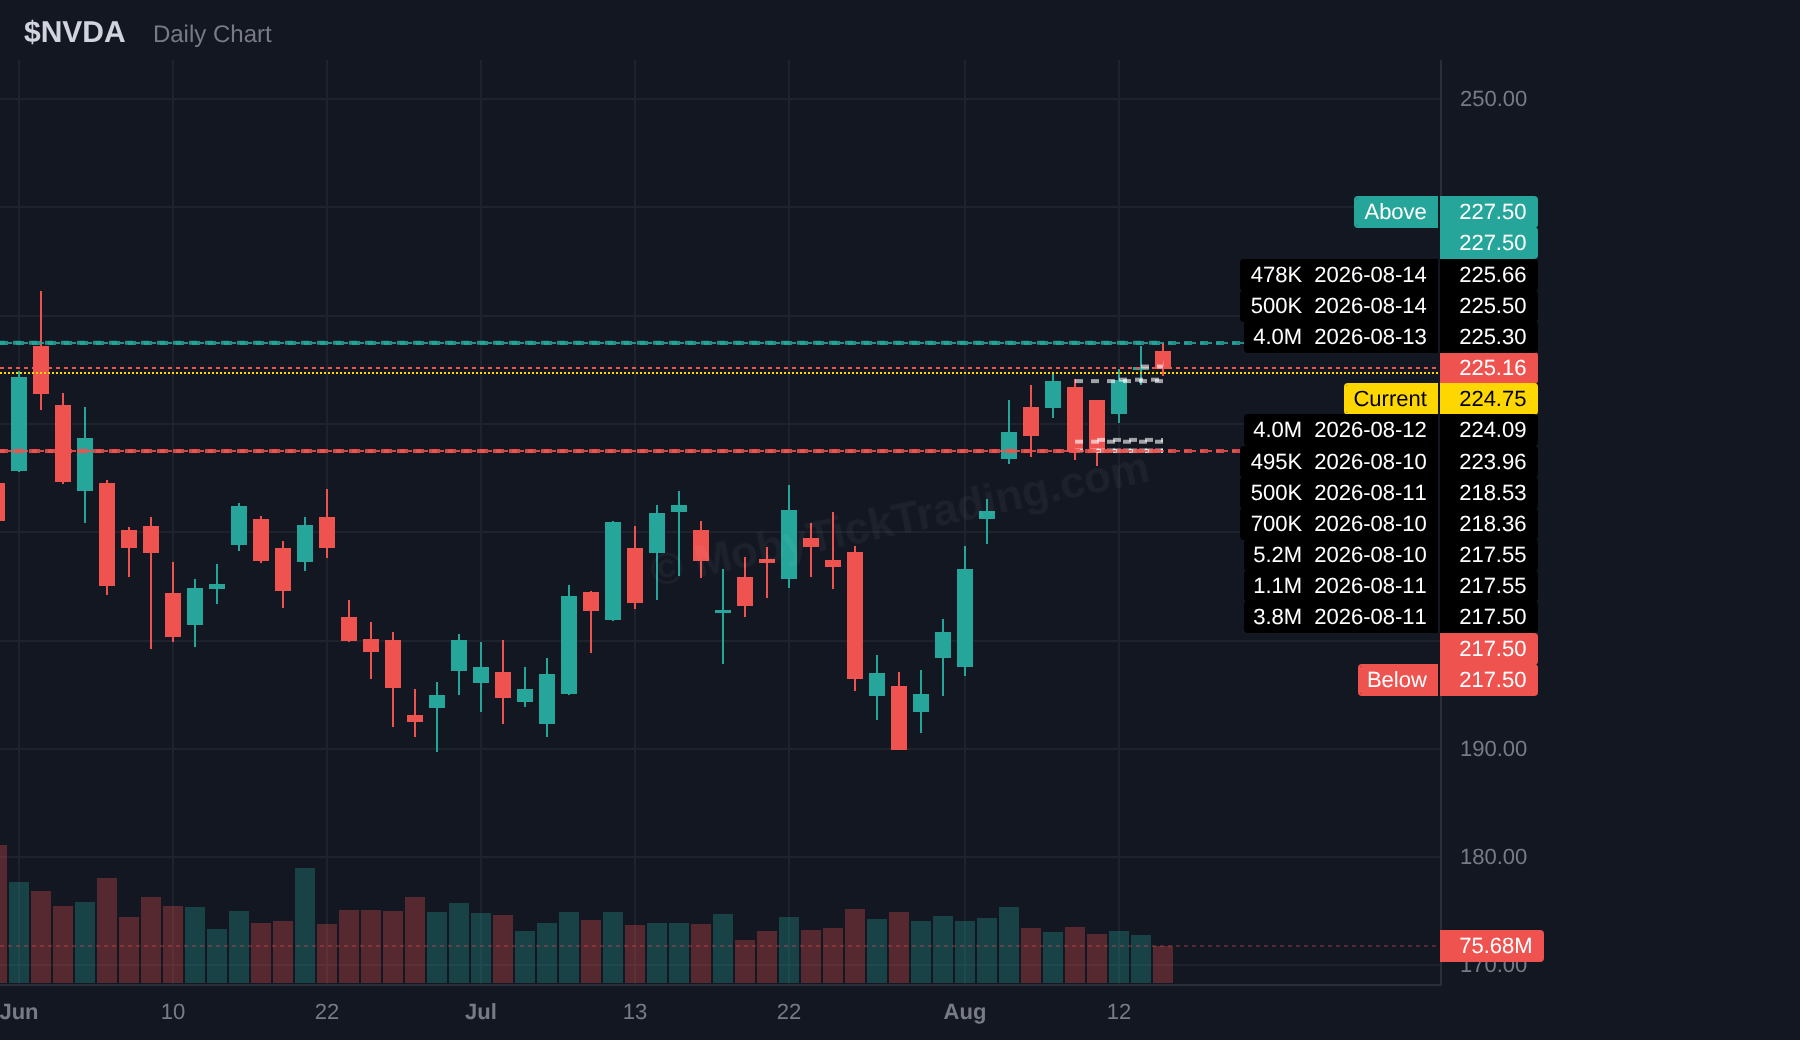
Above $227.50 → $230.00 → $235.00 → $237.50 → $240.00 → $242.50 → $245.00
Below $217.50 → $215.00 → $210.00 → $205.00 → $200.00
NBIS
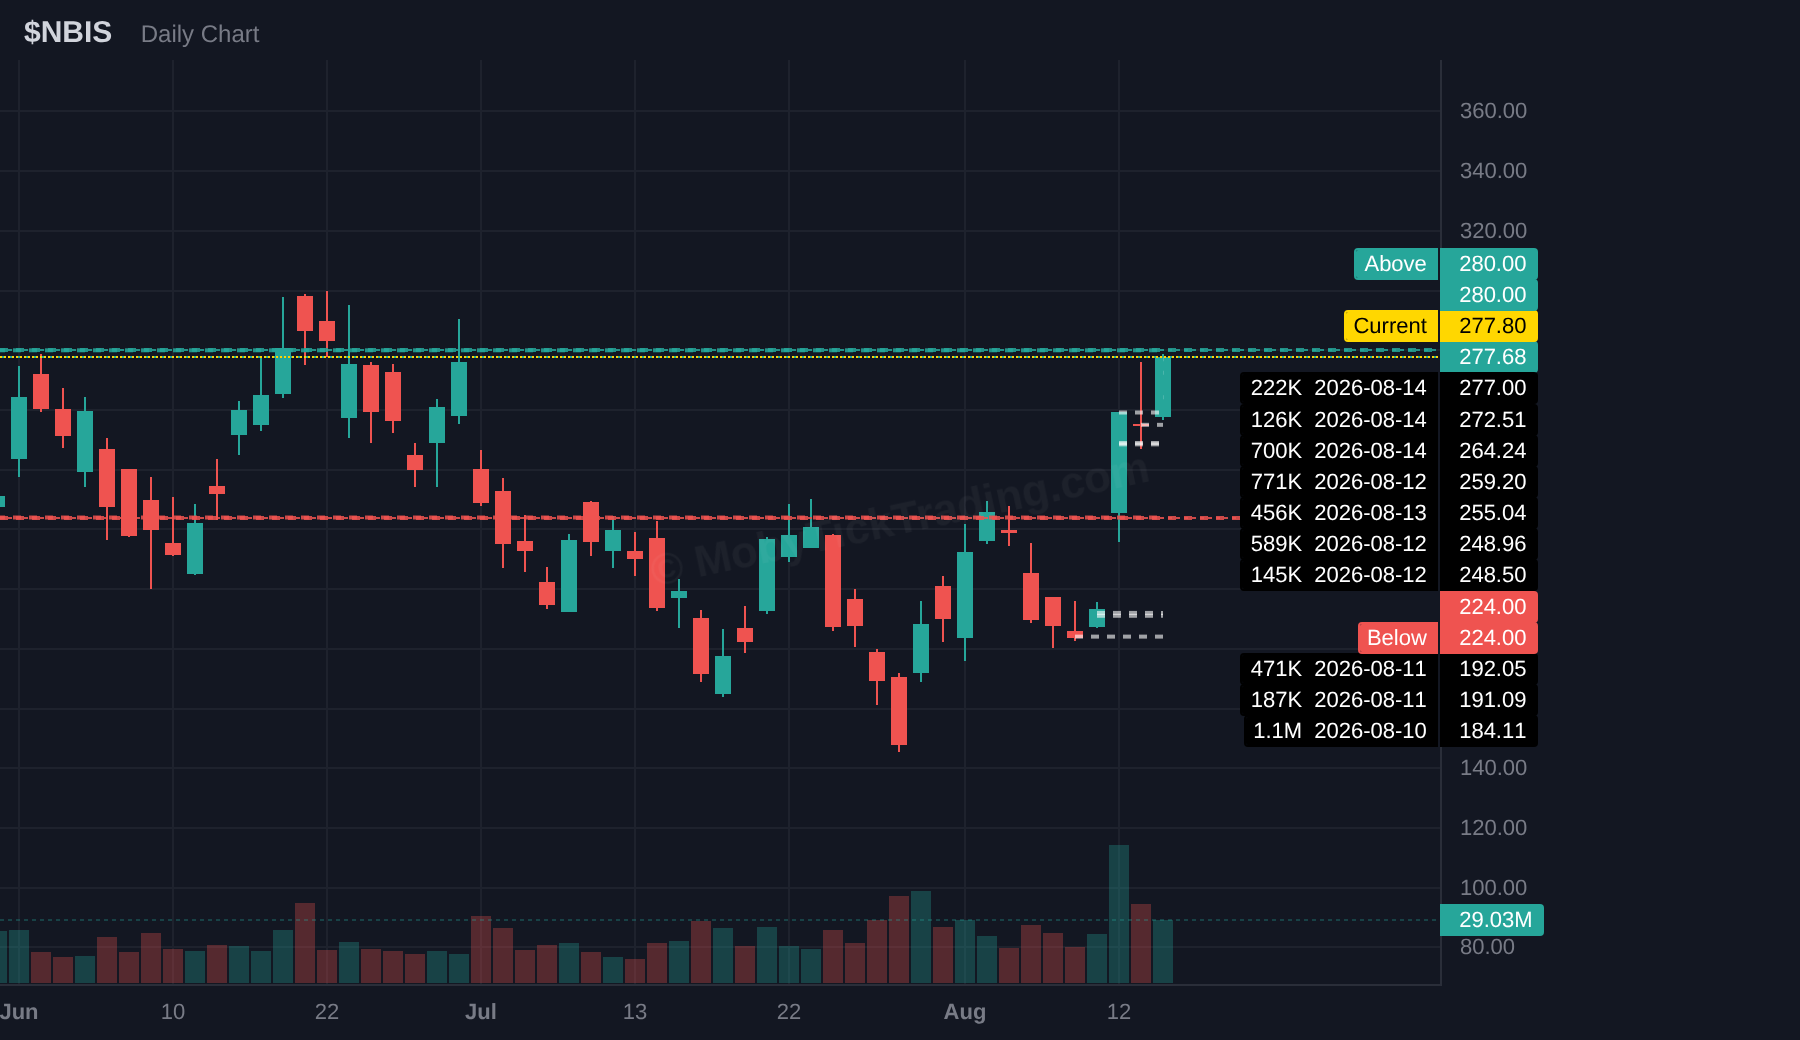
Above $280.00 → $290.00 → $300.00 → $310.00 → $320.00 → $330.00
Below $224.00 → $212.50 → $200.00 → $195.00 → $187.50 → $175.00
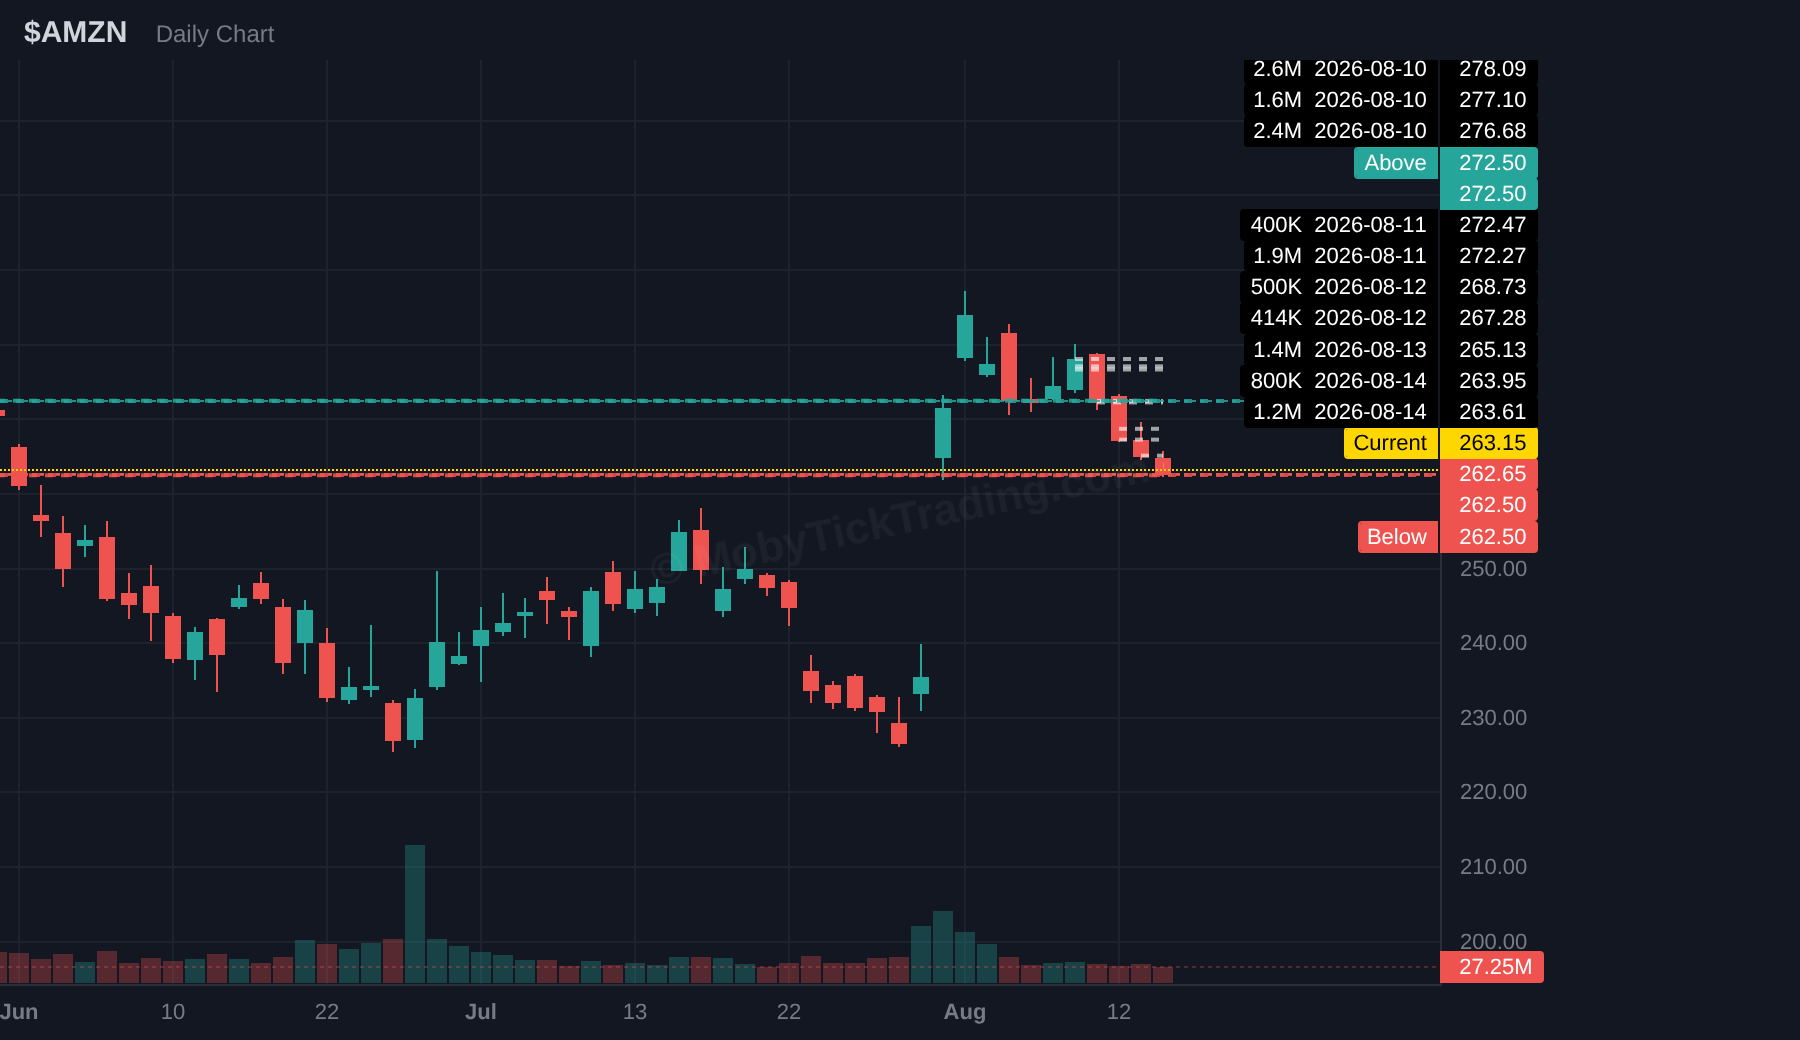
AMZN
Above $272.50 → $276.25 → $277.50 → $280.00 → $284.00 → $287.50 → $290.00
Below $262.50 → $260.00 → $255.00 → $250.00 → $247.50 → $246.00
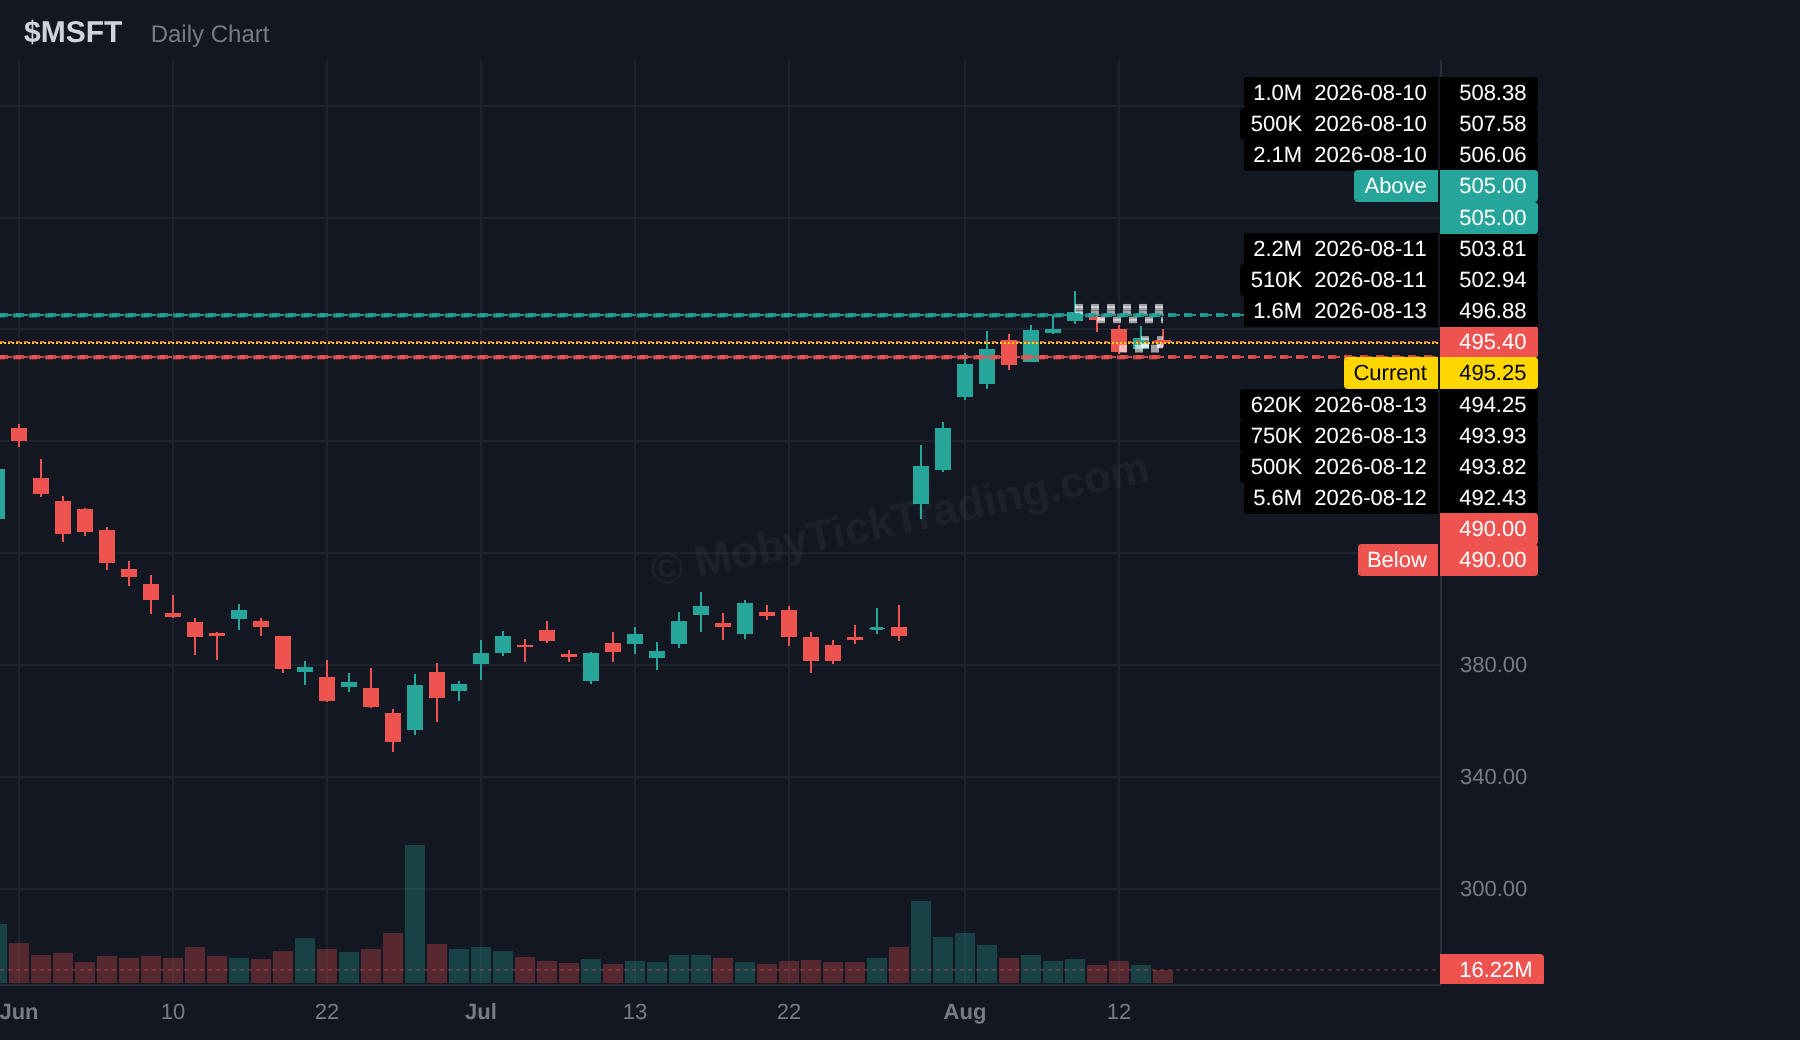
MSFT
Above $505.00 → $510.00 → $515.00 → $520.00 → $525.00 → $530.00 → $540.00
Below $490.00 → $480.00 → $470.00 → $461.25 → $450.00 → $440.00
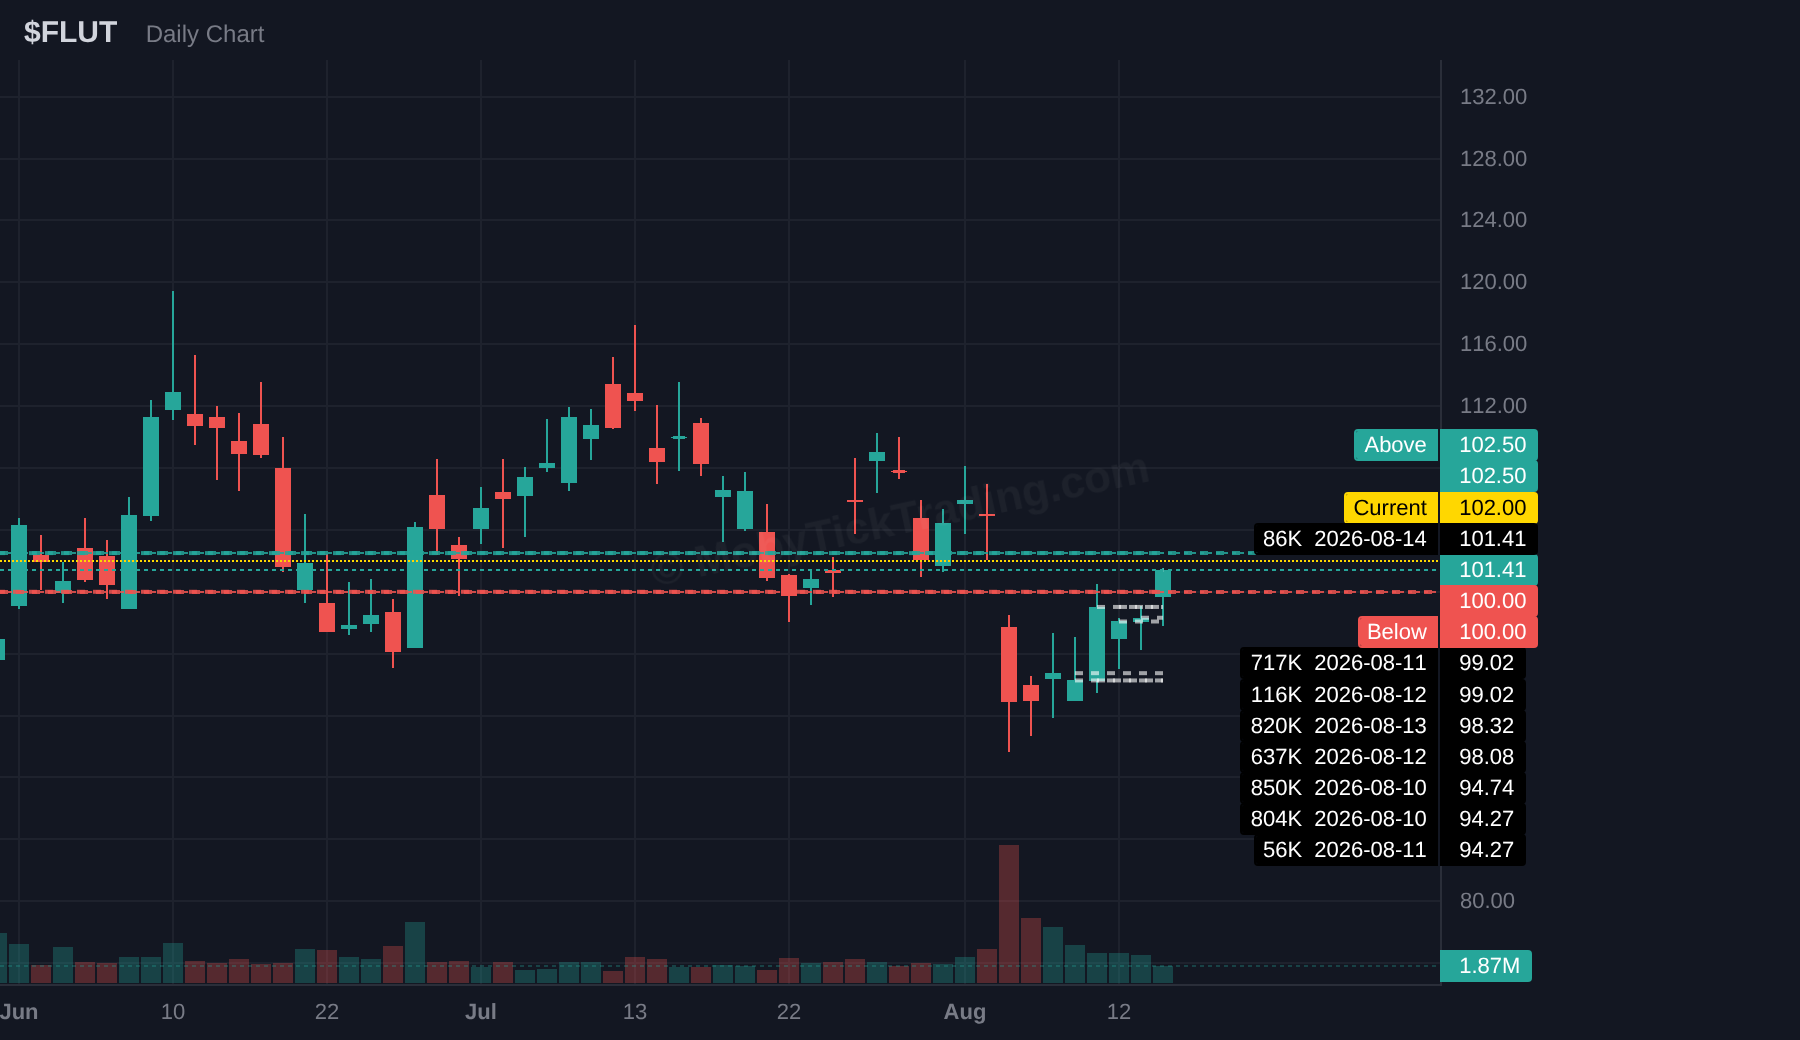
FLUT
Above $102.50 → $105.00 → $107.50 → $110.00 → $112.50 → $115.00 → $120.00
Below $100.00 → $97.50 → $95.00 → $93.00 → $91.00 → $90.00
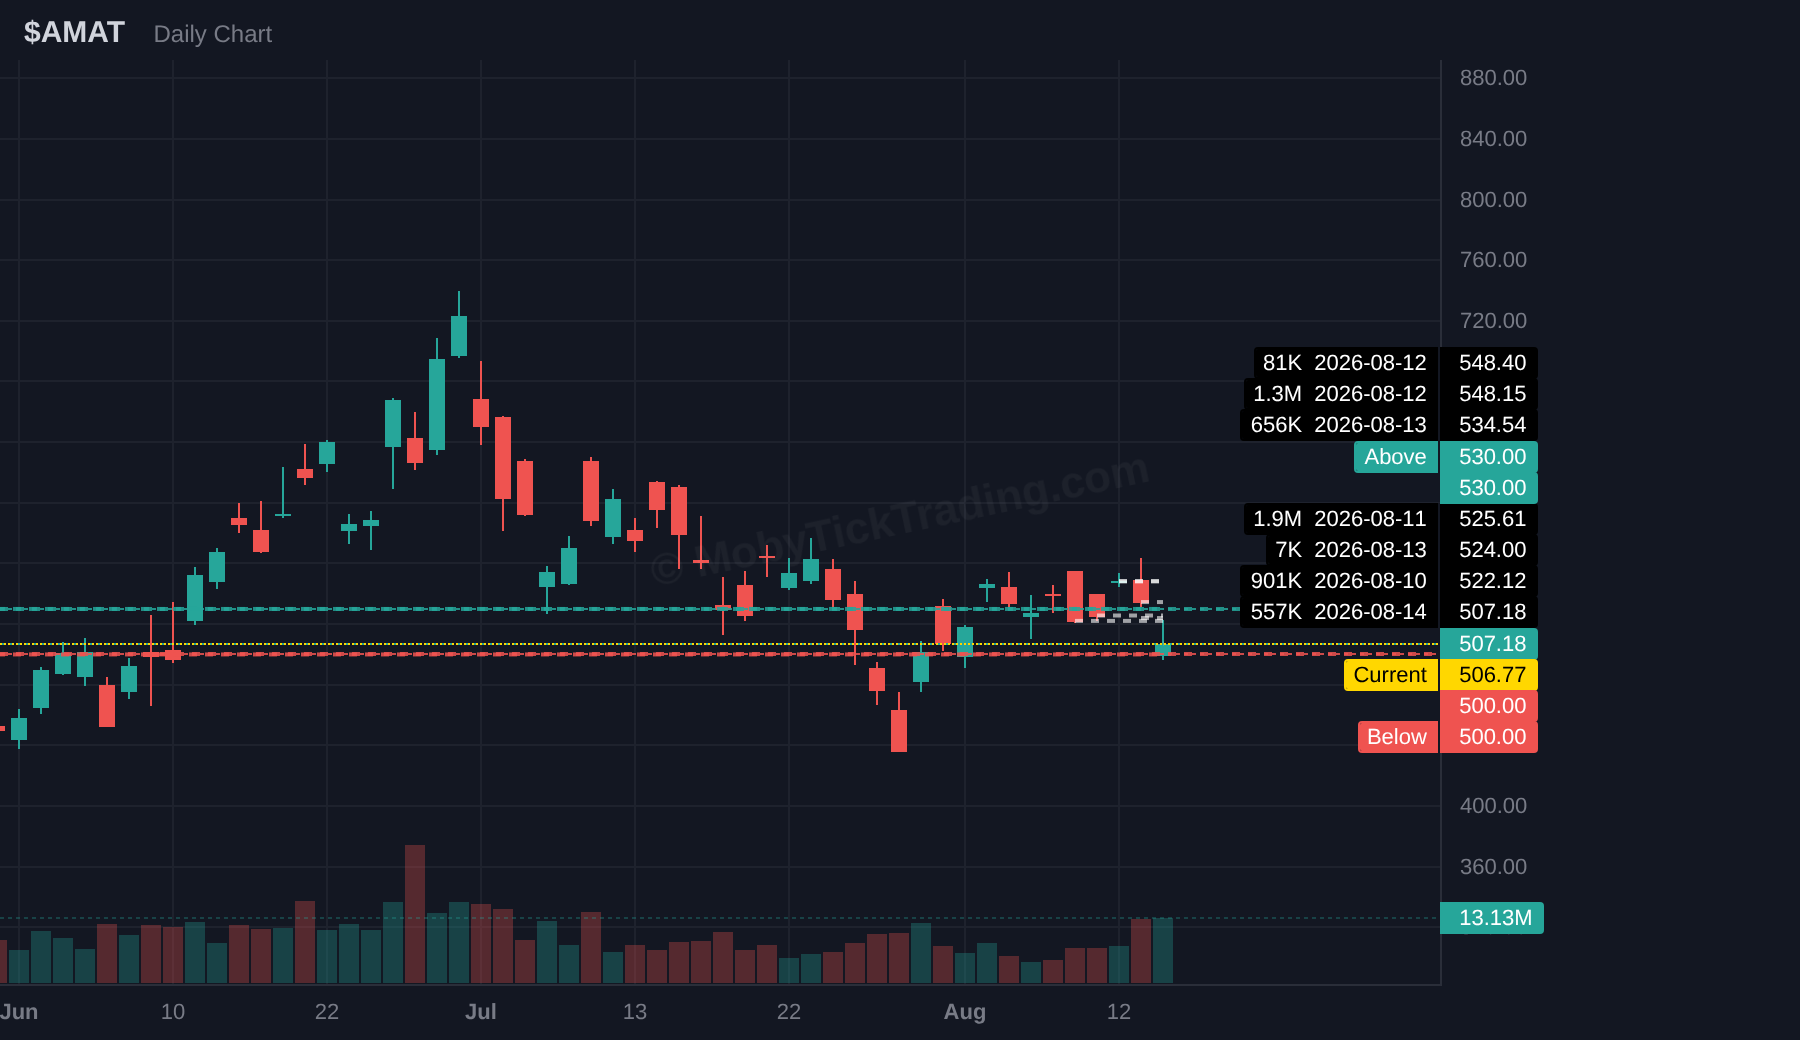
AMAT
Above $530 → $545 → $560 → $577 → $590 → $602.5 → $615 → $625
Below $500 → $480 → $460 → $455 → $440 → $425 → $415
SMCI
Above $41 → $42.5 → $45 → $46.50 → $48.25 → $50
Below $35 → $34 → $33 → $32 → $30 → $27.50 → $25
ETF Dark Pool Flow
Dark pool ETF activity last week was concentrated at the index level. Broad-market funds accounted for roughly $19.26B in non-closing prints of $400K or larger, while the entire sector-ETF complex generated about $1.12B — a gap of more than 17-to-1.
SPY carried the bulk of it at $9.98B across 12.91M shares in 13 prints, the largest single-name ETF total on the tape. IVV followed at $3.34B on 4.29M shares in 5 prints; measured against average daily volume, IVV was the heaviest of the group at 1.03x ADV. QQQ printed $2.83B (3.91M shares, 6 prints), VOO $1.88B (2.64M shares, 5 prints), and IWM $1.24B (4.09M shares, 5 prints). Across those five funds, institutional size was routed into broad index exposure rather than narrower baskets.
Sector-ETF flow was thin and unevenly distributed. XLF (Financials) led with $345.7M on 5.96M shares across 5 prints. XLU (Utilities) was second at $241.4M (5.57M shares, 5 prints), followed by XLC (Communication Services) at $222.6M (2.00M shares, 2 prints) and XLB (Materials) at $212.9M (4.03M shares, 4 prints). XLI (Industrials) registered $74.4M on a single print, and XLE (Energy) $25.3M, also on one print. Five sector funds — XLK (Technology), XLP (Staples), XLRE (Real Estate), XLV (Health Care), and XLY (Discretionary) — recorded no qualifying dark pool prints at all.
The XLK reading stands out against the single-stock tape. Technology and AI-adjacent names produced the week’s heaviest individual flow: MSFT at roughly $6.07B, INTC ~$3.56B, NVDA ~$3.37B, and AMAT ~$2.61B. Each of those single names exceeded the combined total of every sector ETF on the list, while the technology sector fund itself saw zero. Tech exposure last week was assembled name by name, not through the sector wrapper.
Energy showed a similar disconnect. XLE was the week’s best-performing sector at +6.39%, yet the sector ETF drew only $25.3M in dark pool volume across one print — among the lightest readings in the group. The sector’s price move was not accompanied by sector-ETF block activity, leaving individual energy issues as the venue for that flow.
Net of it: index products absorbed the size, sector products saw comparatively little, and the two sectors with the most notable stories on the week — technology and energy — showed the least ETF-level dark pool participation.
*Data sourced from MobyTick*
Educational Feature
A “cross” is simply the relationship between two numbers: a stock’s volume-weighted dark pool average price for the week — the level where institutional size actually changed hands — and where that stock closed on Friday.
Bull cross. Price closes above the dark pool average. Institutional flow accumulated at levels lower than where price ultimately settled, so the tape shows net buying interest behind the move. SMCI was the cleanest version this week: prints averaged $35.18 across 10 prints in all five sessions, and price closed at $39.84 — a +13.25% cross on a +24.50% week (see the SMCI chart). Everything institutions transacted in the dark pool was below Friday’s print.
Bear cross. Price closes below the dark pool average. Flow was distributed at higher levels than where price settled, and the tape shows net selling pressure. AMAT averaged $528.74 and closed $507.18 — a −4.08% cross on a −8.62% week (see the AMAT chart). AMZN carried far more size and landed in the same place: $3.12B across 14 prints, average $272.52, close $262.65, a −3.62% cross. Volume alone did not change the outcome.
Recovery cross. Price dipped below the dark pool average intra-week — often right after a large block hit the tape — and then closed back above it. This is what absorption looks like in the data: the block was taken in, and price re-claimed the accumulation zone before the week ended. NBIS was the week’s most pronounced example, with a dark pool average of $230.56 against a $277.68 close — a +20.44% cross on a +49.23% week (see the NBIS chart). NVDA showed the same shape on the heaviest flow of the tape: 21 prints, $3.37B, average $220.96, close $225.16, a +1.90% cross (see the NVDA chart).
Recovery crosses carry more weight in the screening than a plain bull cross because they contain two pieces of information instead of one. A bull cross tells you where flow transacted relative to the close. A recovery cross also shows that the zone was tested and held — size came in, price went through the average, and the average was re-claimed anyway. This week produced several: NBIS, NVDA, SMCI, and XOM, which closed $160.10 against a $159.62 average across 9 prints in all five sessions.
> Key Takeaway: The dark pool average is a receipt, not a forecast — it records where institutional size traded, and the Friday close is what tells you whether that level held. A zone tested and re-claimed is a different data point than a zone that was never challenged.
*Data sourced from MobyTick*
Ready to Trade with Whale-Level Insight?
Get institutional-grade dark pool intelligence delivered to your inbox every week.
Disclaimer: This newsletter is for informational and educational purposes only. It does not constitute financial advice, investment recommendations, or solicitation to buy or sell securities. Trading stocks, ETFs, and options involves substantial risk of loss. Past performance is not indicative of future results.